

Trader | Analyst | Educator 📊 Helping traders trade with a clear edge | NFA
Dubai, UAE
Joined January 2024
- Tweets2.4K
- Following117
- Followers414
- Likes4.9K




Two traders. Same strategy. Same win rate. Same edge.
One risks 0.5% per trade. The other risks 5%.
Their odds of blowing up the account are not even close.
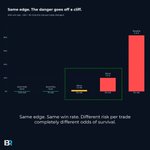
I ran the numbers on a 40% win-rate system with a 2:1 reward-to-risk ratio — simulated over 1000 trades. Here's the probability of hitting a 50% drawdown at different risk levels:
0.5% risk → basically never
1% risk → basically never
2% risk → ~1 in 50
3% risk → ~1 in 5
5% risk → ~5 in 6
Same edge. Same strategy. Wildly different survival odds.
The danger doesn't rise gradually — it goes off a cliff between 2% and 3% risk.
That's not a strategy problem. That's a position-sizing problem.

A 70% win rate can lose you money.
A 35% win rate can make you rich.
Most traders never learn why. I broke down the actual math in my latest video.
🔗 youtu.be/rBY1n5Lbu60

What’s the single most reliable candlestick pattern in your trading strategy? 📊
Whether you trade Crypto, Stocks, or Forex, understanding price action context is what separates successful setups from fakeouts.
I put together a full 59-minute step-by-step masterclass breaking down every key pattern and how to trade them using a 4-step checklist. (AND YES! IT'S FREE) 👇🧵

🚨 CANDLESTICK PATTERNS TRADING MISTAKES
❌ Trading every pattern
❌ Ignoring the trend
❌ Ignoring support/resistance
❌ Treating patterns as guarantees
❌ Entering without confirmation/context
Which one have you made before? 👇

⚠️ BEGINNER CANDLESTICK MISTAKE
Seeing a bullish candle and immediately thinking:
“BUY!”
Candlesticks don't tell you everything.
Before interpreting a pattern, consider:
📍 Trend
📍 Support/resistance
📍 Market structure
📍 Previous price action
A candlestick pattern is a piece of information — not a complete trading system.

🟢 BULLISH ENGULFING
A bullish engulfing pattern occurs when a larger bullish candle completely engulfs the body of the previous bearish candle.
But remember:
Bullish engulfing ≠ automatic BUY signal.
Context matters.

🚨 CANDLESTICK MYTH
“A Doji means the market is going to reverse.”
❌ Not necessarily.
A Doji primarily tells you there was indecision between buyers and sellers.
What happens next depends heavily on the context.
Never trade a candlestick pattern in isolation.

⚡️ One of the biggest mistakes beginners make with candlestick patterns:
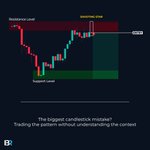
❌ Looking at the candle without looking at the context.
A Hammer in the middle of nowhere ≠ a Hammer appearing after a strong decline at an important support area.
The pattern matters. The location matters even more. 📊

⚡️How confident are you at reading candlestick patterns?
0%Beginner — I’m still lear
0%I know the basics
100%Pretty confident
0%I can read them like a pr
1 votes • Final resultsTrading rewards what no one applauds.
The early mornings.
The missed weekends.
The losses.
The endless screen time.
The discipline to keep showing up.
Then one day, you:
• Trade for 90 minutes
• Make more than most do in a week
• Close your laptop
• Enjoy the rest of your day
People will only see the outcome.
They'll never understand the years it took to earn that freedom.
That's okay.
Keep building.
🚨 THIS IS SCARY FOR THE MARKETS! 🚨
The Fed is turning hawkish again — and traders are noticing.
According to the CME FedWatch Tool, markets are now pricing in at least 2 rate hikes by early 2027, with 3+ hikes by April 2027.
This shift is hammering risk assets:
• Trillions wiped from the S&P 500 in recent selloffs
• Bitcoin down ~20%+ in just one week (and over 40% from its highs)
Higher rates = less liquidity. Less liquidity = pain for stocks, crypto, and growth assets.
Are we heading into a tighter policy regime?
Markets seem to think so. What’s your move? 👇

Bitcoin just printed an 18.57% weekly red candle. The market is bleeding — and most aren't ready for what comes next. 🧵

The setup suggests price is searching for a major structural bottom.
I'm watching for $44,000–$48,000 as the first serious demand zone. The ultimate target range for a Bitcoin cycle bottom: $37,000–$43,000.
My $BTC call from May 25 played out perfectly.
Resistance at $78K → drop into the imbalance zone.
Now here's what I'm watching next. 🧵
1/ Price has tapped into the Imbalance Zone (~$69K–$70K) I flagged weeks ago. This is the area where buyers need to show up.
2/ I'm NOT chasing here. I'm waiting for a confirmation signal — a strong reaction candle or structure shift on the lower timeframe before entering long.
3/ If confirmed, my first target is the $76K resistance zone.
That's where the first real test for any bounce will come.
4/ Invalidation: A daily close below $69K
That flips this into a deeper retracement — not the time to be a hero.
Patience > chasing.
(Sound familiar? 👀)
Chart 👇
$BTC #Bitcoin #BTC #CryptoTA

$BNB +15% in days — but don't get too excited yet 🧵
Two key levels you need on your radar right now 👇
1/ Price is sitting right at a major resistance zone (~$730–780).
This area has flipped bearish multiple times. Until we see a confirmed daily close above it, this is a SELL zone — not a chase zone.
Downside target if rejected: $680 📉
2/ IF (and it's a big IF) price breaks and closes above resistance, the next magnet is the Order Block around $870–885. That's where serious supply sits.
My lean: rejection is more likely than a clean break here.

$BTC tapped the exact resistance zone from my previous analysis and the base scenario played out perfectly. 📉
Now watching for a possible relief bounce into the $76.2K - $76.8K area for a second short opportunity targeting the imbalance zone around $70K
As long as BTC stays below resistance, the downside scenario remains valid.
Patience pays.
#BTC #Bitcoin #Crypto

The final dip is usually the most violent.
That’s how markets remove weak hands.
One last leg down…
Then the move that sends $BTC to $200K
Don’t get shaken out now.