

SoCal data analysis press/consulting/tips: [email protected] Much much more in our weekly newsletter! https://xitter.cf/t.co/FEcnfAQCvH
Los Angeles
Joined August 2026
- Tweets184
- Following100
- Followers3.4K
- Likes460






Pinned Tweet
Our bi-weekly newsletter is packed with even more info about everything we cover!
Sign up now!
basin.la/newsletter.html


LA is bigger but ranks nearly the same, actually comes out slightly ahead of by population.
Counting by land makes the dense older cities even bigger outliers. New York has more than twice as many officers per square mile as anywhere on the list.
We do not suggest counting by land: City limits vary WILDLY. Jacksonville is the largest city by land area which is why it’s at 2.5
Officers per square mile:
New York 111.8
Chicago 50.7
San Francisco 40.3
Philadelphia 37.7
Los Angeles 18.4
Seattle 12.7
Denver 10.2
Dallas 9.6
Columbus 8.4
Houston 8.3
San Jose 6.0
Charlotte 5.5
San Diego 5.4
San Antonio 5.2
Indianapolis 5.0
Fort Worth 5.0
Phoenix 4.8
Austin 4.6
Nashville 3.3
Jacksonville 2.5

The Basin retweeted

I really want to talk about this more but I'm not sure if it belongs on the basin site. I got tons of opinions about how the LAPD could take fairly immediate action to rectify staffing if they wanted to rather than burning money funding more classes that continue to underperform.
Quite a few of you have reached out about our LAPD staffing piece. For clarity, narrowing the list only makes the finding MORE clear, not less.
Of the TWENTY largest cities in the US, LA has more sworn officers per capita than all but five:

ALT Bar chart of sworn police officers per 1,000 residents in the 20 largest US cities, 2025. Chicago 4.25, New York 3.95, Philadelphia 3.24, Dallas 2.45, San Francisco 2.31, Los Angeles 2.24, Houston 2.20, Nashville 2.15, Denver 2.13, Columbus 2.04, Indianapolis 2.02, Jacksonville 1.87, Fort Worth 1.72, San Antonio 1.68, Charlotte 1.64, Austin 1.49, Phoenix 1.47, Seattle 1.34, San Diego 1.25, San Jose 1.07.


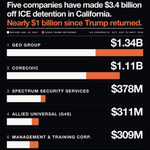
If you haven’t realized just how privatized Trump’s ICE operations have been: every ICE detention center in California is now run by a for-profit company
These five specifically have made $3.4 billion locking up and moving people for ICE here since 2007
Nearly $1 billion of that just since Trump's second term started


The Basin retweeted

This is an amazing map and I am in love with this account. Thanks for pointing them out @hearinladotcom!

LA had 230 homicides last year, the fewest since 1966, and you’ll probably hear that in tonight’s debate.
But a citywide number hides a lot! Even last year, homicides went up in 6 of LAPD’s 21 divisions.
So if you want to see what crime looks like in your own part of the city, we built a map for that.
It covers all 1,135 LAPD reporting districts from 2010 to 2026, with offense categories kept consistent through LAPD’s 2024-25 reporting switch.
Look up your neighborhood and tell us what you find.
basin.la/maps/crime.html


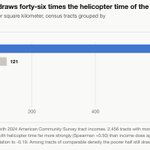
You can see a detailed breakdown of where they fly here
basin.la/articles/twelve-tho…
