

📊 SEBI-Registered Stock Research Portal | 📈 Curated Stock Picks and In-depth Reports | 🚀 https://xitter.cf/t.co/GUiW9ynY8t 📲App: https://xitter.cf/t.co/llkT2dI1Cx
Bengaluru, India
Joined May 2021
- Tweets6.7K
- Following8
- Followers52.6K
- Likes7.1K






Pinned Tweet
Markets are correcting, and opportunities are emerging 📊
As valuations adjust, this could be an opportunity to look beyond the broader market and identify businesses across sectors at more reasonable valuations.
🔍 Check out our smallcases: tradebrainsportal.smallcase.…
🎁 Use code ‘INSTA20’ to get an additional discount on your subscription
You will get access to a wide range of model stock portfolios across:
🔹 Small Caps & Mid Caps
🔹 Renewable Energy
🔹AI & Data Center
🔹 Defence & Aerospace
🔹 Water and waste management
and other emerging and high-growth themes
The objective is to provide diversified exposure to sectors and companies identified through our research process, rather than relying on a single market theme.
🤖 Made with AI

🚨 Strong Breakout Stocks at Weekly Timeframe Charts! 📈
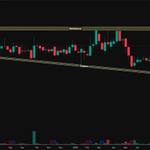
01) #JMFinancialLtd
⚡️Descending Triangle Pattern
⚡️Bearish Signal
⚡️Timeframe: Weekly Chart
ℹ️ Descending Triangle Pattern: A bearish continuation pattern formed by a flat support line and a descending resistance line, indicating increasing selling pressure. A breakdown usually occurs downward when support is breached.

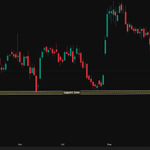
04) #BelriseIndustriesLtd
⚡️Head & Shoulders Pattern
⚡️Bearish Signal
⚡️Timeframe: Weekly Chart
ℹ️ Head & Shoulders Pattern: A bearish reversal pattern with three peaks, where the middle peak is the highest. A break below the neckline signals a potential trend reversal to the downside.

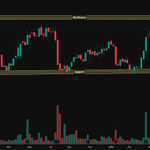
05) #NBCC
⚡️Rectangular Channel Pattern
⚡️Bearish Signal
⚡️Timeframe: Weekly Chart
ℹ️ Rectangular Channel Pattern: A bearish rectangle pattern shows sideways consolidation. A breakdown below support confirms the continuation of the downward trend.
To view the stock & similar technical chart patterns, visit portal.tradebrains.in/resear…
#StockMarket #BreakoutStocks
#Momentum #SwingTrading

🚨 Housing Finance Stock forms a #Bearish #EveningStar
ℹ️ Evening Star Pattern: A bearish reversal pattern where an uptrend stalls with a small-bodied candle, followed by a strong bearish candle, indicating a potential downward trend reversal.
To view the stock & similar technical chart patterns, visit portal.tradebrains.in/resear…
#StockMarket #BreakoutStocks
#PriceAction #ChartPatterns #CandlestickPatterns

🌟 Leading wheel rim manufacturer shares skyrocketed 20% after strong Q2 FY27 results!!
▶️ Revenue from Operations: Rs 1,929.9 Cr (+28% QoQ, +61% YoY)
▶️ PAT: Rs 116.9 Cr (+68% QoQ, +229% YoY)
▶️ Basic EPS tripled to Rs 7.44 per share

📊 CreditAccess Grameen Ltd announced strong Q2 FY27 results!!
Q2 FY27
▶️Total Income: Rs 1,904.8 Cr (+26.2% YoY)
▶️Profit After Tax (PAT): Rs 501.6 Cr (+298.7% YoY)
Operational KPIs
▶️Pre-Provision Operating Profit (PPOP): Rs 970.2 Cr (+39.6% YoY)
▶️Credit Cost: Rs 299 Cr (-43.2% YoY)
▶️AUM & Disbursements: AUM grew 19.5% YoY to Rs 30,946. Cr; Disbursements grew 19.4% YoY to Rs 6,355 Cr.
▶️Asset Quality: GNPA/NNPA at 1.79%/0.59%; Collection Efficiency at 99.71%
▶️Capital & Liquidity: CRAR at 26.9%; liquidity buffer at Rs 3,501.9 Cr
Analysis 🔎
CA Grameen achieved its highest quarterly PAT in Q2 FY27, reflecting a five-fold growth over five years and marking a sharp turnaround with H1 FY27 PAT reaching Rs 995 Cr, up from Rs 778 Cr in the entire FY26. Demonstrating strong financial health, H1 FY27 return on assets (ROA) reached 5.9%, and return on equity (ROE) hit 23.8%, prompting management to revise upward its full-year guidance for ROA to 5.2-5.8% (from 4.0-4.8%) and ROE to 21-24% (from 16-20%). The company maintained its Assets Under Management (AUM) growth outlook at 20-25% and credit costs at 3-4%, while passing on a 50 bps loan price reduction effective October. Now functioning as a highly profitable, rural-focused lender, CA Grameen's diversification strategy is evident at scale, with Retail Finance expanding to 23% of AUM to address broader household financial needs across business, mortgage, housing, and two-wheeler loans. Heading into the seasonally stronger second half (H2 FY27), the company plans to pursue responsible growth and step up new customer acquisition while remaining cautious in regions experiencing drought-related headwinds.
🍔 Zomato vs Swiggy: Who’s Winning the Food Delivery & Quick Commerce Battle? 📊
India’s food delivery giants are growing fast, but their Q2 FY27 numbers reveal a clear difference in revenue, profitability and quick commerce performance!

📊 Adani Energy Solutions Ltd announced its Q2 FY27 results!!
Q2 FY27
▶️ Total Income: Rs 10,239 Cr (+51% YoY)
▶️ EBITDA: Record Rs 3,548 Cr (+67% YoY)
▶️ H1 EBITDA: Record Rs 6,726 Cr (+62% YoY)
▶️ PAT: Rs 1,364 Cr (+145% YoY)
Analysis 🔎
Adani Energy Solutions Limited demonstrates strong operational efficiency and clear growth visibility across its key business segments. The transmission business is driven by high operational availability (over 99.8%) and incentive income, backed by an active pipeline of Rs 87,000 crore across 15 projects and a near-term tendering opportunity of Rs 1.4 lakh crore. The distribution business shows steady momentum through strong power demand, maintaining 99.99% supply reliability and achieving an 11% YoY growth in AEML's Regulated Asset Base. The Smart Metering segment continues to scale, reaching 14.8 million cumulative installations and holding a strong under-implementation order pipeline of 24.6 million metres (Rs 29,519 crore revenue potential). Additionally, the Energy Solutions Platform expands its clean energy footprint through a major 2,500 MW round-the-clock power purchase agreement with MSEDCL. Overall, AESL’s strong execution, expanding order book, and sustainability leadership position it well for sustained long-term growth.
🚨 Tyres & Rubber Products stock forms a #Bullish #EngulfingPattern
ℹ️ Engulfing Pattern: A bullish two-candle reversal pattern in a downtrend, where a small bearish candle is followed by a larger bullish candle that engulfs it, signalling upward momentum.
To view the stock & similar technical chart patterns, visit portal.tradebrains.in/resear…
#StockMarket #BreakoutStocks
#PriceAction #ChartPatterns #CandlestickPatterns

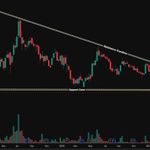
🚨 Telecom Services Stock forms a #Bearish #DescendingTriangle
ℹ️ Descending Triangle Pattern: A bearish continuation pattern formed by a flat support line and a descending resistance line, indicating increasing selling pressure. A breakdown usually occurs downward when support is breached.
To view the stock & similar technical chart patterns, visit portal.tradebrains.in/resear…
#StockMarket #BreakoutStocks
#PriceAction #ChartPatterns #CandlestickPatterns

🌟 Balkrishna Industries Ltd shares rose up to 4.3% after a strategic partnership with Italian premium tyre manufacturer Pirelli 🤝
▶️Phase 1 (Off-take Deal): BKT will manufacture up to 800,000 Pirelli-branded premium tyres in a newly built plant by 2030.
▶️Phase 2 (50-50 JV): Subject to conditions, both companies plan to build a dedicated joint venture plant for high-value car tyres (Pirelli & BKT brands) for domestic and global markets.
▶️Combines Pirelli’s high-end technology with BKT’s local manufacturing strength as India's premium car tyre segment surges.

📊 Goldman Sachs’ Fresh Bets: 5 Stocks to Watch! 💰
Global institutional investors often attract attention when they take fresh positions in Indian companies. Goldman Sachs India’s latest reported stake purchases put these five stocks in focus.

✨Indian Hotels Co Ltd shares rose 5.5% after reporting best-ever Q2 performance!! 📊
▶️ Revenue: Rs 2,566 Cr (+21% YoY).
▶️ EBITDA: Rs 788 Cr (+21% YoY) with an EBITDA margin of 30.7%.
▶️ PAT: Rs 349 Cr (+23% YoY).
▶️ Gross cash balance stood at Rs 4,369 Cr.
Future Outlook 🎯
▶️ Upgraded FY2027 revenue growth to 15–17% (from 12–14%).
▶️ Hotel Segment Revenue growth is expected to be 17-19% for FY2027.
▶️ On track to hit the 700-hotel target well ahead of the 2030 portfolio.
Analysis 🔎
IHCL achieved exceptional Q2 FY2027 performance with strong top-line growth and margin expansion, driven by a 25% surge in domestic same-store RevPAR, a 25% increase in management fee income from rapid openings, and a 25% revenue expansion in the Select Service segment. Overall portfolio growth reached 670 hotels following 47 new signings and 20 openings in H1 FY2027, with additional revenue boosts from the Atmantan and Brij acquisitions.

🚀 Here's why the PC Jeweller shares surge 42% in just a month 📊
▶️ Revenue grew 28% YoY to Rs 1,054 Cr
▶️ EBITDA jumped 74% YoY to Rs 310 Cr
▶️ PAT rose 107% YoY to Rs 299 Cr
Analysis 🔎
In Q2 FY27, PC Jeweller performance was highlighted by achieving debt-free status after fully discharging consortium bank dues and releasing all mortgaged assets and guarantees to eliminate future interest costs. Further bolstered by recovering Rs 142 crore in long-pending export receivables. Driving strategic expansion, the company plans to open up to 100 large-format showrooms over 12-18 months while partnering with NSDC (up to 200,000 partners) and UP’s CM YUVA scheme (up to 1,000 partners) for rural micro-franchise growth in Tier-4 markets. To capture younger consumers, PC Jeweller is launching a high-margin brand focused on demi-fine, lightweight, and lab-grown diamond jewellery, alongside commencing on-site gold mining development in the Republic of Chad via subsidiary PCJ Mining SARL to enable vertical integration.

5 Adani Group Stocks in Which GQG Partners Reduced Its Stake in Q2
tradebrains.in/indian-market…

🚨Fertilizers Stock forms a #Bearish #AscendingChannel
ℹ️ Ascending Channel Pattern: A bearish pattern where price breaks below the lower support of an ascending channel, signalling a potential end of the uptrend and the start of downward momentum.
To view the stock & similar technical chart patterns, visit portal.tradebrains.in/resear…
#StockMarket #BreakoutStocks
#PriceAction #ChartPatterns #CandlestickPatterns

🚀 L&T Technology Services Ltd shares jumped up to 15% after Q2 FY27 results!!
▶️ Revenue: Rs 3,040.4 crore (+12.1% YoY) | USD Revenue: $317M (+4.8% YoY CC).
▶️ Net Profit: Rs 548.2 crore (+66.8% YoY), supported by a Rs 165 crore one-time gain from the SWC disinvestment.
▶️ EBIT Margin: Improved to 16.3% (+60 bps QoQ).
▶️ Deal Wins: $200M+ in large deal TCV, with AI-led deals accounting for over 50%.
▶️ Declared an interim dividend of Rs 20 per share.
Analysis 🔎
LTTS management highlighted accelerated sequential growth driven by Engineering Intelligence (EI) and strong large-deal execution. Key operational highlights include achieving a 16.3% EBIT margin ahead of schedule, launching an NVIDIA-partnered Physical AI Lab, reaching $120M in annualised EI revenue, and surpassing 1,800 total patent filings. Sustained momentum in mobility and strong growth in sustainability support management’s confidence in strengthening H2 revenue momentum while preserving healthy margins. Management reaffirmed its 5-year target of a 13-15% revenue CAGR with 16-17% EBIT margins.