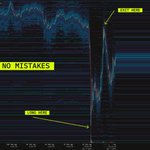
Man, we suck sometimes.
Aggregating charts is just embarrassing.
Somehow slipped our attention during release.
We'll fix it.
here's something.
hyperliquid live liquidations, heatmap, stop losses and take profit all on one screen.
most apps would show you static picture, here you can zoom into the abyss (and back).
accidentally building best way to explore HL data.
Just for lulz – a model that's trained on real hyperliquid data (left picture).
Its weights are then applied to binance markets and you get same kind of looking picture.
Looks beautiful.
Predicts much worse than other models,
BUT STILL BETTER THAN COINGLASS.
LOL.
On liquidation heatmaps.
People been asking us to add them.
We finally caved and:
- built a model,
- benchmark engine,
- a leaderboard for best predictive model among competition.
Any "proprietary/innovative algo" is a coverup for incompetence.
No bench -> no trust.
👇
TL;DR – don't rely on them
The biggest shocker (not really) – Coinglass implementation is statistical garbage.
Its "secret" – just ask @grok to explain you this:
heat(p) = Σ over 5-min candles since chart start ½ · max(ΔOI, 0) at p = price · (1 ± 1/L), L ≈ 100, 50, 25
Our HyperLiquid liquidation heatmap is realtime (obviously), insanely fast and deep.
Reason – we are running our own node.
No HL data provider (to the best of my knowledge) has realtime liquidation heatmap of that caliber.
Irony.
"Some" version of heatmap/charts takes one prompt and 10 min.
And a new wave of order-flow "products" show up daily on TL.
However, in October we've seen ATH people using TapeSurf.
Very interesting time.
Thinking of switching to viridis as a default heatmap theme for everything.
We had a good run sticking with bids/asks coloration, but maybe it is time.
We take loading speed seriously.
How serious?
Lets say other apps still spin their logos, while we already show heatmap :)
And previous version was already fastest on the market.
A new version, however, is even faster.
gn!