

Ecologist, ornithologist & nature lover, prof of ecology & conservation at Uni of York. Author of 101 Curious Tales of East African Birds. Trustee @ARochaUK
- Tweets4.4K
- Following914
- Followers1.5K
- Likes2.1K







ALT Image of a book cover, with two lovely little bee-eaters torturing a bee.


ALT Poster advertising Act Now! A conference on faith and the environment.


ALT CASCADE screenshot, cascade.ac.uk

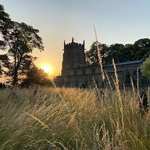
ALT Crocuses in a churchyard
ALT Crocuses in a churchyard

ALT A dead bird with a red ring. Bird is yellow/green and with black wings and tail


ALT A graph showing Net Primary Productivity (NPP) in relatively natural vegetation types against the NPP difference between the natural and human modified systems. In places with low initial NPP human modification increases NPP, in places with higher initial NPP it decreases. Major modifications have slightly more extreme effects than minor ones.

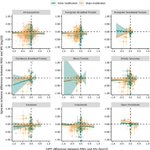
ALT Graphs showing the relationship between species richness difference and net primary productivity (NPP) difference for different relatively natural land cover types. Richness differences are the log10 of the proportional species richness differences between every modified site (MV) and the mean value of relatively natural sites (RNV) for a specific land-cover type in the same substudy. Year-averaged NPP shown; adjusting cropland productivity for human appropriation. Single circles indicate the mean species richness difference values for each relatively natural land-cover type and modification combination within substudies (vertical and horizontal lines show standard deviations). There's no obvious patterns anywhere, really!

