

Growth Stock Investor. Focused on finding & trading True Market Leaders. Lead PM https://xitter.cf/t.co/xOknKiZTl0 TML Model Portfolio.
Joined August 2014
- Tweets14.8K
- Following99
- Followers93K
- Likes6.4K



Pinned Tweet
I'm excited to be working with @TCMLLC & tickermonkey.com to bring the TML Model Portfolio to fruition! This is a service of my passion for finding #TrueMarketLeaders, studying their big moves, capturing the move while applying a set of rules, (1/3)
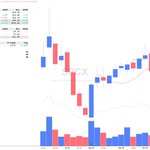
$SPCX had a mini-gap down on Thursday below the 150 level, then closed back above the 50-day line on what appeared like a shakeout, It traded with an inside day on Friday, just below the 50-day line. See how it acts on earnings next week, 10/20, AMC.


$XP had a Monster Gap + Day 2 Higher High on 10/5 (+D2HH +30.93% on almost 7x average volume) as it traded at a new 4-year high. Brazilian stocks gapped up on geopolitical news. It gained 49.86% two weeks ago, then pulled back last week as it undercut the short term 8-day EMA.


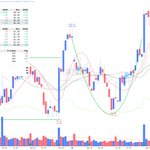
$ANF had a Monster Power Earnings Gap (MPEG) on its latest earnings report on 8/26 with a 35.67% gain on over +1100% volume. It has consolidated around the range of its gap for about 7 weeks in a 15.7% deep shallow cup or a flat-tish base as it found a support around the 21-day EMA. Its RS line is at a new high. See if it breaks out from here or if it forms a short handle.


$CAKE cleared the 111 pivot of a cup with handle on about average volume. It is approaching the 118.46 pivot of its base. EPS on 10/27, AMC.


$LLY reclaimed the 10-week/50-day SMA line on Wednesday, then had a mini-gap up on Thursday, above the 1215 marked high. It formed a flat base (1292.65 standard pivot, base-on-base). See if it forms a short handle or if it follows up from here. EPS on 10/29, AMC.
Charts courtesy of @MarketLens_
Try MarketLens free for 7 days here:
marketlens.amphibiantrading.…
Use Promo Code: TML for 10% off on the first payment.


Weekend Review, 10/18: 40% to 60% Exposure
Technology heavy indexes Nasdaq, QQQ and QQQE took big hits with the sell-off on AI stocks.
Nasdaq, QQQ, QQQE, S&P 500 closed below their 50-day lines.
Russell 2000 and S&P 400 broke below their long term 200-day lines.
Distribution Days: 2 - Nasdaq, 8 - S&P 500.
$QQQ $SPY $MDY $IWM
Charts courtesy of @tradingview


TML Trader retweeted

HPE AMD PLTR SPCX are a few of the names @TMLTrader has landed well in this cycle on the TML Model.

$PLTR followed up after clearing the 188.37 pivot of a flag or a deep cup with handle. It closed at an all-time high as it broke above the 207.52 prior all-time high of this deep structure.


$ANET broke out of the pivot of its shallow cup with handle (212 standard pivot) on just above average volume on Tuesday. It cleared the high of this flat-tish base (214.89 standard pivot, 206.13 early pivot, depth: -15.6%) or a shallow cup with handle. It finished at an all-time closing high with its RS line at a new high.


$DDOG rebounded after finding support at the short term 8-day EMA, then closed at an all-time high with its RS line at a new high. It cleared the pivot of a cup base (292.72 standard pivot). Weekly chart showed accumulation with 5 consecutive up weeks. See if it forms a high handle.


$LITE cleared the pivot of a 45% deep base (1085.68 standard pivot) after breaking above a 3-weeks tight pattern on the right side of its base. Weekly chart showed 5 consecutive up weeks with blue skyscrapers. Its weekly RS line is at a new high.


$SNOW rebounded on heavy volume after finding support at the 21-day EMA and the 10-week SMA. It cleared the 348.61 3-weeks tight pivot, then finished at a new 4-year closing high with its RS line at a new high. The next level to watch is the 384.56 high from the stalling Power Earnings Gap (PEG) on 9/3.


$MU slightly undercut the 21-day EMA in the prior two sessions as it closed just below the 1036.13 early pivot. It formed a cup with a two-week handle (1108.72 standard pivot). See if it can reclaim the 21-day EMA, then watch for a breakout from the handle.


$AMD undercut the short term 8-day EMA as it pulled back and broke the 5-week winning streak. See if the 600 Century Mark and the 21-day EMA will provide support should it continue to pull back.


$DELL cleared the high from two weeks ago, following up after a nice shakeout at the 21-day EMA. Its weekly RS line is at a new high. On watch if it can clear the pivot of a 4-weeks tight pattern (595.51 standard pivot) and the 600 Century Mark.
Charts courtesy of @MarketLens_


Weekend Review, 10/11: 80% to 100% Exposure
Nasdaq, QQQ and S&P 500 ended at all-time weekly closing highs.
Distribution Days: 2 - Nasdaq, 8 - S&P 500.
$QQQ $SPY
Charts courtesy of @tradingview


$SPCX breaks above the IPO day close of 160.95 on above average volume, following up from last Friday's reclaim of the IPO day open.


$SPCX reclaimed the 149.80 marked high and the 150 Open of the IPO day as it bounced off the 21-day EMA on above average volume. Next level to watch is the 160 level and the IPO day / Close of 160.95.


$SPCX reclaimed the 149.80 marked high and the 150 Open of the IPO day as it bounced off the 21-day EMA on above average volume. Next level to watch is the 160 level and the IPO day / Close of 160.95.