

HFA trader. 30K+ hrs & 10+yrs of tape, structure & execution. Free weekly class: https://xitter.cf/t.co/tBnwhi4Mez https://xitter.cf/t.co/quQrqQ32VY
- Tweets4.2K
- Following434
- Followers579
- Likes5.8K





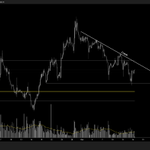


ALT LINKUSDT perpetual 30m chart on a black background, price at 12.291. A long descending Creek line runs from the 12.75 area, with a smaller Mini Creek line under the 5 high near 12.27. A blue 1-2-3-4-5 count rises from the 11.51 low with a CISD level marked on the way up, then a red a-b-c correction ends near 11.83 just under the 11.907 prior lows. A labeled arrow marks the RangerBreaker CHoCH where price broke the Mini Creek, followed by a heavy-volume candle to about 12.46 and a shallow pullback that is holding above 12.10.

ALT ETHUSDT spot 1h chart on a black background, price at 2,440.20. A yellow circle marks the small c-leg low near 2,372, just above a shaded blue support zone with a line at 2,357.10. Price broke out of the short descending wedge from there, then ripped to about 2,477 on the heaviest volume bar of the recent stretch before easing back to 2,440. Blue wave labels count 1 through 5 with red a-b-c corrections, and the Creek line and falling channel sit behind the whole move.

ALT ETHUSDT spot 1h chart on a black background, price at 2,440.20. A yellow circle marks the small c-leg low near 2,372, just above a shaded blue support zone with a line at 2,357.10. Price broke out of the short descending wedge from there, then ripped to about 2,477 on the heaviest volume bar of the recent stretch before easing back to 2,440. Blue wave labels count 1 through 5 with red a-b-c corrections, and the Creek line and falling channel sit behind the whole move.


ALT BTCUSDT daily chart on a black background, price at 82,322. Yesterday’s candle wicked down to just under 80,000 on the heaviest volume of the last two weeks, then closed back near 82,200. A yellow point of control line sits near 77,250 below, with a white level near 83,500 overhead. The volume profile on the left shows a thick cluster of trading between roughly 76,000 and 84,000, and today’s candle is holding above yesterday’s close.

ALT ETHUSDT spot daily chart on a black background, price at 2,457.32. A long lower wick from yesterday’s candle dips to about 2,318, through the 2,363 low and the red 2.618 extension at 2,338, then closes back near 2,442. A yellow line near 2,505 marks the point of control, with another level at 2,600 above and 2,406.89 just below price. A volume profile sits on the left and yesterday’s bar shows one of the heaviest volume readings of the last two weeks. Today’s candle is holding above the reclaimed lows.

ALT LINKUSDT spot 4h chart on a black background, price at 12.612. A descending trendline labeled Creek runs down from the 14.85 area across a series of lower highs. A horizontal line at 11.916 marks the support that was just wicked to about 11.85 before price closed back above it. A yellow line near 11.50 marks the point of control below, with a white level near 13.10 above. The volume profile on the left shows a thick cluster below price and thin volume between 12.70 and 13.10.


