

Senior Economist at First Trust Portfolios. Love Jesus, family, investing, real estate, soccer and golf very much.
San Diego, CA
Joined April 2009
- Tweets4.9K
- Following562
- Followers5.8K
- Likes4.8K



Pinned Tweet
One of my favorite economists, Frederic Bastiat. Written in the 1800's just as applicable today:
"Between a good and a bad economist, this constitutes the whole difference—the one takes account of the visible effect; the other takes account both of the effects which are seen and also of those which it is necessary to foresee. Now, this difference is enormous, for it almost always happens that when the immediate consequence is favorable, the ultimate consequences are fatal, and the converse. Hence it follows that the bad economist pursues a small present good, which will be followed by a great evil to come, while the true economist pursues a great good to come, at the risk of a small present evil."
Strider Elass retweeted

This is one of my favorite charts. 📊
Regular gas prices in 🔴 states vs. 🔵 states.
Gasoline prices have risen for everyone since the Iran War started in February. There is absolutely no doubt that the blockade in the Strait of Hormuz (which, as of the time I'm writing this, is improving) was the cause.
But regardless of recent price trends amidst ongoing geopolitical tensions, prices tend to be cheaper than the national average and median (a more appropriate metric) in red states. On the other hand, blue states tend to run more expensive, the exceptions of course being Colorado (a surprise to me), Maryland (barely), and my home state of Virginia.
These differences primarily boil down to gas tax rates. Democrat-run states have higher tax rates because, well, Democrats like higher taxes. This should not be a shocker to anyone.
California takes the cake, though. The gas tax rate of $0.63 / gallon is the highest in the United States, and environmental regulations (e.g., cap-and-trade and their low-carbon fuel standard), which add another $0.21 to $0.26 / gallon, impose significant burdens on consumers.
Assuming that you drive a vehicle with a 26-gallon tank and fill up every 1.5 weeks, on average, Californians spend ~$2,335.36 more per year on gas than Indianians. Left-wing energy policies are nuts.

Strider Elass retweeted

Anduril is investing $3.7B into Arsenal-2.
The next great American Shipyard.
Who would have thought?!

So you want to “tax the rich”, do ya?
The LA “Mansion Tax” in its first 3 years has resulted in:
* a revenue DECREASE of $452 million
* 9100 new home constructions blocked (1000 of which were “affordable housing”)
* 16,650 full time construction jobs lost
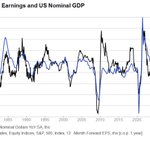
Great chart from New Edge Wealth’s @CameronDawson. Look at how far earnings have pulled away from nominal GDP.


EARNINGS UPDATE FOR ANOTHER ABSOLUTELY MASSIVE QUARTER: 495/500 companies in the S&P 500 have reported for Q2. 86.3% have surprised to the upside. Earnings are +33.9% from a year ago. (Yes not a typo!) Overall, consensus was estimating +23.2% YOY at start. Revenues are +15.7% YOY vs. +12.1% estimate at the start.
$SPY
$SPX
$QQQ
$VIX #SP500 #SPX500
Tariff revenue still coming in strong. So far this year, $189 billion has been collected in customs duties, putting 2026 on pace for the largest year of customs duty revenue in history.

EARNINGS UPDATE FOR ANOTHER ABSOLUTELY MASSIVE QUARTER: 468/500 companies in the S&P 500 have reported for Q2. 85.7% have surprised to the upside. Earnings are +32.5% from a year ago. (Yes not a typo!) Overall, consensus was estimating +23.2% YOY at start. Revenues are +15.4% YOY vs. +12.1% estimate at the start.
$SPY $SPX $QQQ $VIX #SP500 #SPX500
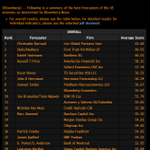
Bloomberg ranked the First Trust Economics Team Second for Top Forecasters of the US Economy in the 2nd Quarter. @wesbury @BobStein_FT

Strider Elass retweeted

Elon Musk has created massive wealth. It’s wealth, it’s not cash. It represents an accumulation of assets that are being used to create goods and services for all. Some want to take this and give it away to be consumed by others. It’s called “eating your seed corn.” A perfect way to guarantee a smaller crop, less growth and lower standards of living for everyone. Socialism creates more equality by making “everyone” poor. Except for the leaders, of course, who will somehow take more from this system.
EARNINGS UPDATE FOR AN ABSOLUTELY MASSIVE QUARTER: 494/500 companies in the S&P 500 have reported for Q1. 83.4% have surprised to the upside. Earnings are +29.6% from a year ago. Overall, consensus was estimating +12.4% YOY at start. Revenues are +11.6% YOY vs. +9.4% estimate at the start.
$SPY
$SPX
$QQQ
$VIX #SP500 #SPX500
Having @Starlink on @united flights is an absolute game changer. It’s amazing how fast and reliable it is. Any other flight is maybe 50% it actually works and when it does it’s incredibly slow.
Take now, I have no idea if this is actually going to get published as the internet on this flight is just terrible.
@starlink needs to be deployed to all flights and airlines
Strider Elass retweeted
What in the world? The American Federation of Teachers and an advisor to Union-affiliated pension funds ( neither of which are investors in SpaceX) are both asking the SEC to investigate Musk World. The Lilliputians keep stringing thread. Impede and harass strategy.
Strider Elass retweeted

"Data center expansion is not currently the predominant driver of increased electricity prices in U.S. states"
spglobal.com/ratings/en/regu…

Strider Elass retweeted
My piece on Fed Independence and Jerome Powell…Cry Me A River…Real Clear Politics
Jerome Powell and So-Called 'Fed Independence' realclearpolitics.com/articl…

EARNINGS UPDATE AN ABSOLUTELY MASSIVE QUARTER: 322/500 companies in the S&P 500 have reported for Q1. 81.7% have surprised to the upside. Earnings are +25.9% from a year ago. Overall, consensus was estimating +12.4% YOY at start. Revenues are +10.9% YOY vs. +9.4% estimate at the start. $SPY $SPX $QQQ $VIX #SP500 #SPX500
If you’ve followed the guidance of financial professionals and built a well-diversified portfolio, there’s a possibility your performance in Q1 2026 may have exceeded that of the Index.
Reason being the decline was largely driven by its biggest constituents, whose outsized weightings can disproportionately pull the Index lower.
Consider this: the top-performing stock of the quarter, SanDisk Corporation, surged 167.7%. Yet with a weighting of just 0.14%, it contributed only 0.09 percentage points to the Index.
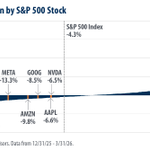
Meanwhile, NVIDIA fell 6.5% but carries a roughly 7.6% weighting—dragging the Index down by about 0.5 percentage points, more than five times the impact of SanDisk’s gain, but in the opposite direction.
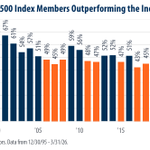
In fact, 290 stocks outperformed the Index during the quarter. Equal-weighting all 500 companies would have produced a positive return of 0.7%, compared to the -4.3% decline in the traditional market-cap weighted Index.

In 2023, just 26.9% of stocks outperformed the Index, the narrowest market since at least 1995. That pattern persisted in 2024 and 2025, with only 27.7% and 30.5% of stocks beating the Index, among the most concentrated stretches in nearly three decades.
Such narrow leadership hasn’t been seen since the late 1990s and that period was followed by a meaningful broadening in market participation.
That shift may now be underway.
In Q1 2026, 57.8% of stocks outperformed the Index. If sustained, this would mark the broadest market since 2009.

The “Magnificent 7”—Apple, NVIDIA, Microsoft, Amazon, Tesla, Alphabet, and Meta—currently make up a hefty 33.3% of the Index.
Yet in Q1 2026, they were anything but magnificent. All seven posted losses and, together, drove almost all of the 4.3% decline in the Index.
Microsoft led the drop, falling 23.3% and subtracting 1.4 percentage points on its own, the largest single negative contributor.
Meanwhile, the other 493 companies collectively shaved just 0.45 percentage points off returns, highlighting how concentrated performance among the market’s giants continues to drive broader Index moves.
