


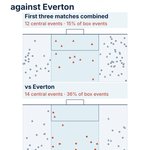


ALT Two penalty-area maps compare Spurs’ recorded on-ball events. The first three league matches combined had 12 central events out of 79 box events (15%); against Everton, 14 of 39 were central (36%). Red marks central events. Circles show non-shot events; triangles show shots. Both maps use the same scale.


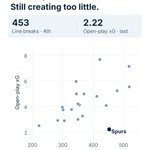
ALT Scatter plot of all 20 Premier League clubs after four matches. Line-breaking passes are on the horizontal axis; open-play xG is on the vertical axis. Spurs, highlighted in navy, rank fourth for line-breaking passes (453) but last for open-play xG (2.22).


ALT Scatter plot of all 20 Premier League clubs after four matches. High regains are on the horizontal axis; sequences ending in a shot are on the vertical axis. Spurs, in navy, have two shot-ending sequences from 34 regains. Brentford, in blue, have nine from 35. High regains are open-play possession gains within 40 metres of the opposition goal.

ALT Scatter plot of all 20 Premier League clubs after four matches. Shots are on the horizontal axis; expected goals are on the vertical axis. Spurs, in navy, have 51 shots and 3.45 xG. Manchester City, in blue, have 52 shots and 7.68 xG: almost the same number of attempts, but more than twice the total xG.


