

🇹🇭🏴 Half Thai Half English - Part Time Trader - Part Time Entrepreneur - Part Time Investor
Joined April 2024
- Tweets2.3K
- Following286
- Followers133
- Likes5K


Frosty retweeted

There's a new indicator on @tradingview called Options Volume Profile.
Makes it super easy to visually see the option volumes at each price level.

Frosty retweeted

THE NEW ICT PD ARRAY HAS ARRIVED 🚨
Meet The ICT “BOLO” PD Array — THE DEFENSIVE PD ARRAY. 🛡️
After 50+ hours of backtesting, it showed a 75% effectiveness rate.
Another powerful addition to the ICT Arsenal.
Thank you, Michael J. Huddleston For This New Gem




Frosty retweeted

CPI Wednesday is going to make 90% of traders lose money before lunch. Here's the exact playbook so you're not one of them 👇
🧊 COOL PRINT (0.1% or below)
Market gaps up ~+0.24% at the open. That strength gets sold, median −0.27% intraday fade. The reversal isn't real, though: cool prints ran +1.05% over the next 3 sessions, the strongest follow-through of any outcome
📊 Don’t chase the gap up. Let the morning sellers finish, the real move comes over the rest of the week, so buy the dip
✅ IN-LINE (0.2%, the forecast)
Near-zero intraday drift, tightest range of the three. Vol bleeds out once the event risk resolves. 71% close green, highest rate of any bucket and still +0.55% over the next 3 sessions
📊 Buy the Intra-Day Dips
🔥 HOT PRINT (0.3%+)
Gaps down ~−0.30% at the open. Every hot print since 2023, 9 of 9, closed at or above that open and even the scary scenario averaged +0.73% over the next 3 sessions. The fade edge weakens on the biggest gaps though, those tend to stick more
📊 Remember bears are the crowded trade. Buy the dip and ride the wave back up
There's only three way this can play out, and now you know all three
Frosty retweeted

These are 3 types of key-level reactions.
Now you might ask:
How do I know which tap is the real one and which one will be the final low?
Time filters out the noise (OLHC/OHLC👀)
If a key level gets tapped at the end of the HTF candle formation, that reaction is more likely to be a fake low.
The probability of that low holding is lower, and price is more likely to revisit it.


Frosty retweeted

Quote of the Day:
"Focus on tight ranges. Doesn't matter what time frame. Tight ranges is all you should focus on. Wide and loose is for losers and tight is for winners."
— @Qullamaggie


Frosty retweeted
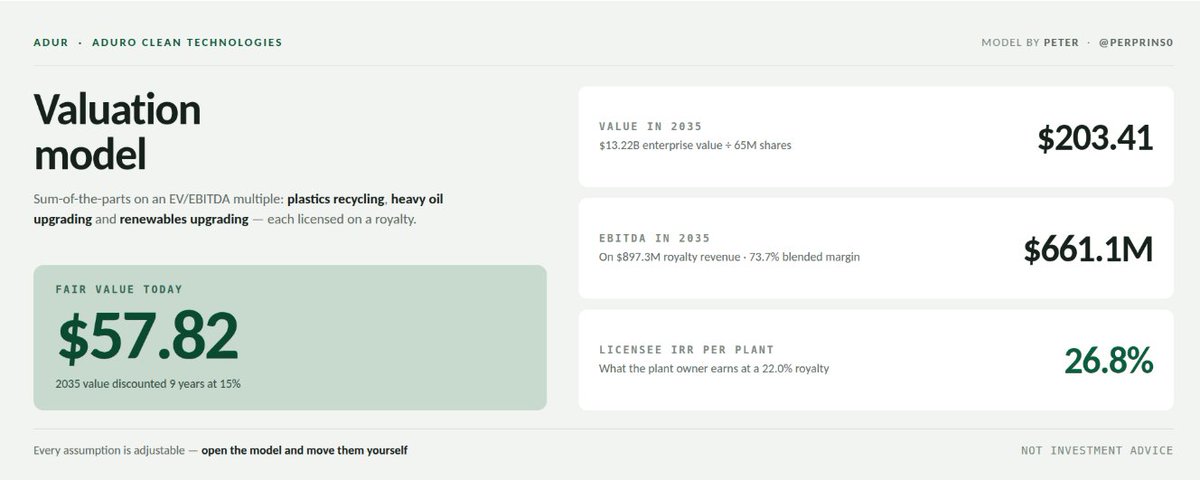
My $ADUR Long Term Valuation Assumptions
Aduro is pre-revenue, so there's no P/E or sales multiple to lean on. What we can do is build the licensing engine from the ground up and see what it produces.
That's what I did.
I'm modeling two of the three verticals here: plastics and heavy oil. Renewable oils are left out entirely, so anything that vertical adds is upside on top.
I'm going to model Aduro as a licensor. As this is the path the management team is aiming to go forward.
I built three scenarios:
- Bear case - uses pretty conservative numbers for both the plastics per ton revenue and value uplift per barrel;
- Base case - assumes more normal prices for both verticals;
- Bull case - assumes a premium, MOAT type of price for the two verticals.
All of them assume: 44.2M shares float (taking in consideration 30% dilution) and 80% EBITDA margins (typical for a royalty/IP business).
Vertical 1: Plastics:
Revenue per tonne: what the recycled output sells for.
Circular feedstock trades around $700/tonne today (it tracks naphtha). Bear case uses that conservative number.
Base and Bull use $1,500 and $2,500, more in line with what the management has been saying.
Royalty rate: Aduro's cut of the licensee's sales. I used 20% on all 3 scenarios.
The world makes around 460M tonnes of plastic a year. Aduro only needs a slice of the total TAM. I assumed:
Bear: 0.5% → 2.3M tonnes
Base: 1.0% → 4.6M tonnes
Bull: 3.0% → 13.8M tonnes
Vertical 2: Heavy Oil Upgrade:
Regarding the Heavy Oil Upgrade vertical, A doesn't sell feedstock... it takes a cut of the value its technology creates per barrel.
Net value created per barrel = the value uplift from upgrading ($10–15) + transport savings ($3–10) − operating cost ($3–5).
Licensing fee: Aduro takes ~25% of that value created.
With an addressable pool of 5M barrels/day of heavy and waxy crude and assuming a penetration slice:
Bear: 0.5% → 25,000 bbl/day
Base: 1.0% → 50,000 bbl/day
Bull: 3.0% → 150,000 bbl/day
For comparison: the Uinta Basin alone produces ~185,000 barrels/day of waxy crude. Even the bull case is not the total amount of the Uinta Basin.
Putting everything together:
Adding both verticals, applying the 80% margin, then a valuation multiple x EBITDA:
- 8x in the bear case
- 12x in the base case
- 20x in the bull case
And dividing it by 44.2M shares, gets us to the Implied fair share price (USD) presented in the image below.
But I'm only considering a fractional % penetration of the total TAM. And I'm only considering the 2 most well known verticals.
I strongly think $ADUR's technology, can really address a $1T TAM in the longer term.
So yeah... TBH I think I'm being kinda conservative.
Anyways, those were my assumptions, do your own due diligence, do your own math and ask any question regarding why I used X, Y or Z.


Frosty retweeted

1) Determine a Draw On Liquidity - where Price is likely reaching; like NWOG, PDH\PDL, Session H\L.
2) Wait for opposing liquidity raid, during or immediately after a 10\50 Macro.
3) Entry on 1st FVG in the present price structure or use IFVG in the run to opposing liquidity to your Draw On Liquidity.
4) Frame your risk to 1% or less, Hard Stop Loss placement beyond Candle #1 of the FVG you used for entry.
5) Take 50% of position off at half of the range between your entry and the Draw On Liquidty, the balance limit out just before your Terminus.
Wash, Rinse, Repeat... nothing fancy or complicated.


Frosty retweeted
PSP + SMT Fill > 2 Stage Continuation
The ideal continuation sequence for lagging assets utilizing asset synchronization.
I prefer this over the 1 stage variant, SMT fill
When the leading asset trades into a key level, and has few close proximity further draws.
SS PSP confirms lagging asset redistribution and SMT Break.

Frosty retweeted
It is always these 5 components.
It is always in this order.
Don't change the order, that's what protects you.
1. Draw on Liquidity
2. Daily / Protraction Profile
3. Key Level
4. CiC
5. LTF Reversal Signature
Understand this better than anyone else... then add more filters....


Frosty retweeted

At Lathyrus, we believe in creating clarity and independence for our students.
We put together a flow chart for the community so each and every person has a clear roadmap for what to look for, remove any guessing games and make trading easier.
But instead of keeping this exclusive to Lathyrus, we decided to post it to the public. We hope this helps those that are struggling.
Thread 🧵


Frosty retweeted

The AI supercycle is year 3 of 15. You're still super early!
Millionaires will be made by knowing whats coming and being patient. This is buy and hold market.
Pay attention, we just finished Phase 1 2023-2025
$NVDA → AI GPU king powering training, inference, and hyperscaler demand.
$MU → High-bandwidth memory critical for AI servers and massive compute.
$COHR → Photonics and optical connectivity enabling ultra-fast AI data transfer.
$MRVL → Custom AI networking chips powering cloud and hyperscale infrastructure.
PHASE 2 transititioning into in 2026–2027
$IREN → AI-focused data centers securing scalable power for compute expansion.
$WULF → Energy-efficient infrastructure supporting massive AI compute requirements globally.
$VRT → Cooling and power systems preventing AI data center bottlenecks.
$ETN → Electrical infrastructure backbone powering hyperscale AI facility growth worldwide.
$CEG → Nuclear and clean energy demand exploding from AI power consumption.
$ANET → High-speed networking moving enormous AI workloads between GPU clusters.
$MRVL → AI networking silicon connecting compute, memory, and cloud infrastructure.
PHASE 3 (this is massive bottleneck from 2027-2029)
$MP → Rare earth materials essential for robotics, EVs, and defense systems.
$USAR → Domestic critical mineral supply chain supporting future AI manufacturing.
$ASTS → Space-based connectivity enabling global autonomous and AI communication networks.
$RKLB → Affordable launch infrastructure supporting defense, satellites, and AI expansion.
$KTOS → Autonomous warfare and AI-driven military systems entering mass adoption.
$TSLA → Real-world AI robotics, autonomy, manufacturing, and autonomous transportation leader.
$SYM → Warehouse robotics automating global logistics with AI-powered machine systems.
PHASE 4 — Full automation (2030+)
$MSFT → AI operating layer integrating agents into enterprise software ecosystems.
$GOOGL → Search, infrastructure, and AI distribution dominance across the internet.
$META → Consumer AI ecosystem integrating assistants, commerce, and social platforms.
Quantum plays → Next-generation computing unlocking exponential AI capability breakthroughs.
The pattern is simple:
Infrastructure → Expansion → Domination.
We are only in Year 3 of 15.

Frosty retweeted
How to profile a trading day
Always get intraday direction.
Every trading day fits into one of four profiles.
Knowing the profiles and when to trade them is key
Here are the four profiles and when to trade them
Chapter 2 of The Essence Series.
A thread.
credit @_amtrades
