

8 yrs trading US markets | Momentum • Risk-first Finding setups early. Tracking what happens next. My research & market prep ↓ https://xitter.cf/t.co/07Sv9gTxIY
Global | US Markets
Joined February 2012
- Tweets1.1K
- Following10
- Followers101
- Likes135





Pinned Tweet
8+ years trading US stocks taught me something important:
Finding a strong stock is only half the job. Knowing when to trade it, how to manage risk, and when to stay out matters just as much.
I'm the trader behind Sniper Alpha.
I use AI-assisted screening to narrow down thousands of US stocks, but the final decisions come from my own chart analysis, experience, and trading rules.
Here, I share setups, market observations, trade follow-ups, and lessons from my own trading journey.
The workflow below is how I approach the market every day.
No valid setup. No trade.
If you trade momentum and trends, you'll probably feel at home here.
sniperalpha.com
🤖 Made with AI

$AMC is refusing to give up $3.00, even while the major indices are getting shaken.
That's the kind of strength I like to see.
Price has been holding around the old resistance, building a tight box, and now taking another shot at a breakout.
I jumped in on the first volume-backed breakout. So far, the structure is holding up nicely.
Will this be the start of the next leg higher?


$AMC Is Back at the Scene of the Breakout.
After clearing $3.00, $AMC pulled back and slipped back into the box instead of running straight higher.
Now this area matters. If price can hold here and bounce again, the box could turn into the next swing-low structure for the trend.
This is exactly the kind of pullback I’d rather watch than chase an extended candle.
Anyone who missed the first breakout waiting for this $AMC pullback?

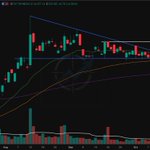
$WDAY held strong while the rest of Tech was getting hit. That's relative strength.
I've been tracking this setup since September. The triangle kept tightening, volume dried up, and price refused to break support.
Now the breakout is here.
I jumped in. Love how this structure developed, especially against a weakening Tech sector.
Anyone else on this train? 🚂

$WDAY is getting tighter by the day.
Average volume keeps fading while the structure keeps compressing — that tells me sellers aren’t getting much follow-through, and buyers still seem willing to defend the same support instead of chasing higher prices.
Now the triangle is getting pretty clean.
This is the kind of setup I’d rather wait on than force.
$WDAY looks worth keeping on the radar — do you think this compression is loading the next move?

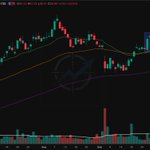
$TXN — Missed the breakout? The pullback might offer another shot.
Flagged $TXN on Sep 25 before it broke out.
I extended the old resistance line, and guess what? Price is now trying to hold it as support.
The pullback has also formed a nice bull flag, bringing price back to a much more interesting risk/reward area.
Now I want to see buyers defend this level before considering an entry.
Anyone looking to trade $TXN from here?

$TXN +8.5% since I shared it on Sep 25.
Back then, price was still building a base above the major EMA. Now the resistance is gone and the move is underway.
That’s the whole point of my framework: find the stock before the move, not after everyone sees it.
If your process only finds stocks after they run, aren’t you always chasing?

$HUT — Same playbook, but this time the trend says otherwise.
Back on Sep 19, I was watching for another bounce from the purple EMA.
Fast forward, price has shifted from a higher low to a lower low, broken support, and all three EMAs are starting to curl downward.
The structure has clearly deteriorated.
Lesson: Trend is your friend. When I'm hunting for longs, a stock behaving like this won't make it through my screener anymore.
Anyone still looking for a bounce on $HUT?

$HUT — déjà vu, anyone?
Last time, price rallied, pulled back to the big purple EMA, then took off again.
Now, after another correction, it’s bounced from that same EMA and is trying to reclaim momentum.
Same playbook, different chapter. Will history rhyme?

$NBIS — From a bullish ascending triangle to a potential double top.
Flagged this on Oct 5 as price was tightening below resistance.
The ascending triangle failed, followed by a breakdown below the purple EMA. Now price is back testing July support around $165.
Zoom out, and a potential double top becomes visible.
Lesson: My screener gives me clues, but confirmation is what triggers a trade. No confirmation, no position.
Will $NBIS bounce from this support, or is another leg down coming?


$VSXY — Tech selling off, but where's the money going?
My sector rotation screener is starting to pick up more names in Consumer Discretionary ($XLY). Looks like some money may be finding shelter there.
$VSXY caught my attention.
After bouncing off the purple EMA, price has been building a consolidation box, tightening near resistance.
I like the structure here. Now waiting for buyers to show their hand.
Anyone else watching $VSXY?

Tech is selling off. So where's the money going?
My sector rotation screener is starting to pick up something interesting in Consumer Discretionary ($XLY).
In today's Market Prep:
3 setups I never traded, and why
3 Consumer stocks on my radar
Where institutional money might be rotating next
Sometimes the trades you skip teach you more than the ones you take.
Full breakdown in the first reply 👇

Full Market Prep 20/10 here 👇
sniperalpharesearch.substack…
Sector rotation, chart breakdowns, and the trading framework I actually use every day.
$XMTR — A good setup means little when the sector loses strength.
Flagged this earlier when price was building a tight base above old resistance. The structure looked promising.
But sector weakness changed the picture. Buyers couldn't hold the breakout, and $XMTR got dragged back into its previous sideways range.
This is why I watch sector rotation, not just individual charts.
The wind seems to be shifting, and I'm not interested in fighting it.
Anyone still watching $XMTR?

$XMTR is getting interesting again.
Built a clean base, compressed around the EMAs, then finally broke out.
Now it’s building a smaller base above the old range and near the EMA — exactly where I want to see buyers hold their ground.
Breakout continuation or one more shakeout first?

$AMZN — Money rotating into $XLY? Follow the leader.
Flagged $AMZN on Oct 12 after it showed up on my screener.
The pullback into the purple EMA gave a nice bounce, and price has since built a consolidation box above the old resistance.
Risk/reward is getting interesting here, with volume starting to pick up.
Money seems to be finding shelter in $XLY, and $AMZN is one of the heavyweights leading the way.
Anyone else jumping on this train?

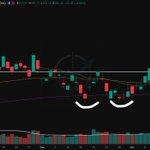
$AMZN — Double bottom, breakout next?
Beautiful pullback into the purple EMA, which held twice and formed a clean double bottom.
Now price is pushing above resistance.
I like the structure, but I'm waiting for a better risk/reward setup before jumping in.
Are you chasing the breakout or waiting for a better entry?

$GLBE — Is money rotating back into Consumer stocks?
My screener is starting to pick up some activity in the Consumer sector again, and $GLBE is one worth watching.
After bouncing off the purple EMA, price has been tightening inside a consolidation box.
I like the risk/reward here, but I'd rather see a clean breakout before making a move.
Anyone else keeping $GLBE on their watchlist?

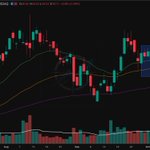
$CVE — From watching the box to taking the trade.
Flagged this setup on Oct 13 while Energy was showing strength. The breakout finally triggered, and I jumped in.
Now my job is simple: follow the trade plan and let price do its thing.
If my thesis is wrong, the risk is already defined. No guessing, no improvising.
Let's see how this one plays out.
Anyone else trading $CVE?

$CVE — The next Energy move might be building inside this box.
While $XLE continues to show strong relative strength against $SPY, $CVE has spent the recent pullback tightening into a consolidation box.
The golden EMA area is holding as support, and price is starting to compress near the upper boundary.
I like this kind of reset after a strong run. Now I want to see buyers confirm it.
Anyone else watching $CVE for the next swing higher?

$ACMR — Well, it launched alright… just in the wrong direction. 😂
Remember my Oct 1 post? The double bottom looked promising, but the breakout turned into a fakeout.
Price rolled over, lost all 3 EMAs, and even smashed through the previous double-bottom support.
From my experience, this is not healthy price behavior. The structure has clearly deteriorated.
Anyone still holding $ACMR in their portfolio?


$STX — From breakout candidate to breakdown. That turned ugly fast.
Following my Oct 2 post, the tight base near resistance failed. Price broke below the box, sliced through the purple EMA, and took out the blue support around $700 too.
Not the price action I was looking for.
My screener helps me spot potential setups. But spotting one and actually taking a trade are two different things. Price confirmation comes first.
Anyone still holding $STX, or already out?


$DOCN — Looks like the moon trip got canceled. 😂
Following my Oct 5 post, the base broke down, the purple EMA gave way, and now even the last support is gone.
Fresh lower low. Ugly price action.
My screener flagged the potential, but potential means nothing without confirmation. That's why I wait for price to prove itself.
Anyone still holding $DOCN, or already out?


I put together my Market Prep every trading day, along with updates on some of the positions I'm managing.
I treat it as my trading journal — documenting what I'm watching, how I read the market, and the decisions behind my trades.
If you're curious about the framework I've built over the years, feel free to check out today's article below.
Maybe you'll find something useful for your own trading process.
Article in the first reply 👇
🤖 Made with AI

Today's Market Prep: Tech Is Breaking Down. So Why Are My Positions Still Green?
Portfolio updates, sector rotation, and the setups I'm watching next.
sniperalpharesearch.substack…
$U — Both sides got swept. Now the bulls have a problem.
Following my last update, price swept liquidity below support, then pushed above resistance, only to fail the breakout.
Now it's back testing the old support around $40.
The last three daily candles don't look encouraging, and the weekly chart has printed a bearish engulfing candle.
I'm watching how buyers defend this level, but the price behavior is raising red flags.
Anyone still holding $U? How are you managing it?

$U — The Sweep Happened. Now I’m Waiting.
Follow-up from my Sep 24 post.
$U swept liquidity below the range, but the EMA golden area held. Price bounced hard from there and is now sitting right back at the mini resistance.
I like the reaction, but I’m not chasing the noise. I’d rather let things calm down and see what structure comes next.
I’m waiting here — are you waiting too, or taking the shot?

$VSAT — The squeeze resolved, but not in the direction bulls wanted.
Following my September 21 post, price broke below the symmetrical triangle support and lost the purple EMA.
Now it's back testing the horizontal support around $59.
The problem? The broken trendline and EMAs are now overhead resistance instead of support.
To me, the winds have shifted. This is no longer the bullish structure I was watching.
Can $59 hold, or is another leg lower coming?

$VSAT — The squeeze is getting interesting.
Price has been compressing into a triangle, with volume gradually drying up during consolidation.
Now it's bouncing off the lower trendline and heading back toward resistance.
Will the bulls punch through this time, or does the triangle need one more squeeze?

$SSNC — Tech is pulling back, but this one keeps showing up.
Following my last post, SSNC did exactly what I wanted to see: bounced off the EMA zone, printed a bullish engulfing candle, and pushed right back into resistance.
Now the next question is simple.
Does price digest here with a tight sideways base, or do we get a deeper pullback first?
Either way, this is the kind of relative strength I keep watching when the rest of Tech is under pressure.
Anyone else tracking $SSNC here?

$SSNC — Quiet strength while QQQ is under pressure.
Price pulled back cleanly into the golden EMA area, built a small base, and now printed a bullish engulfing candle.
What stands out to me is the relative strength. While QQQ is getting pressured, SSNC is still holding its structure well.
Is this the kind of setup that starts moving before the index turns?
