

Institutional-grade on-chain capital markets. Tokenized private market access, structured products, and risk-defined DeFi.
Decentralized
Joined August 2018
- Tweets2.1K
- Following222
- Followers26.3K
- Likes465




Pinned Tweet
Singular Perpetuals now Live! Trade 9 major cryptos with up to 50x leverage. 🌐
✅ Low Liquidation Risk with quality price feeds
✅ Save on trading costs with minimal spreads
✅ Easy swaps via a simple interface
Elevate your trading at singulardex.com . Experience efficiency & security in every trade!
#SingularPerpetuals #BTC #ETH #AVAX #SOL #singulardex
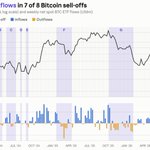
ETF investors don’t buy the dip. They sell into it. Over the ETF era, spot Bitcoin ETFs saw net outflows in 7 of 8 sell-offs of 15% or more, and net inflows in all 9 rallies. They bought on the day of the peak at 7 of 8 tops and sold on the day of the low at 7 of 8 bottoms. The two most recent sell-offs brought the heaviest selling yet: -$6.9B (Oct 2025 to Feb 2026) and -$8.2B (May to June 2026).

Some popular signals don’t hold up. IBIT’s flows predict price no better than the rest of the complex (0.08 correlation with the next day’s return). Big inflows on quiet days show no edge since 2025. Big outflows on quiet days preceded weaker 20-day returns, but that rests on 12 cases across just seven periods. Part of the flow is also the CME basis trade: hedge funds hedged roughly a fifth of ETF flow, and their net CME short has fallen from about 116k BTC in Dec 2024 to about 29k now. Today’s flows are a cleaner read of real demand than in 2024.

Takeaway:
Institutional money through ETFs hasn’t made Bitcoin safer in a sell-off. It has added a large group of investors who behave like momentum traders. ETF flows confirm moves, they don’t predict them. As always, the sample is small (8 sell-offs) and correlation isn’t causation, so treat this as a pattern, not proof.
Memecoin mania grabbed the headlines, but the fundamentals are what moved. Over the past month, DeFi TVL rose 3.7% to $91.9B, mostly from fresh money. Onchain fees climbed 5.2% to $2.41B, stablecoins onchain reached $311B, and tokenized RWA protocols grew 1.7% to $4.79B. For the first time this year, the data is starting to back the “everything comes onchain” narrative.

The same logic shows up in how research firms are building crypto baskets. Citrini’s recent basket leans toward fee-generating infrastructure protocols across trading, lending, yield and derivatives, with derivatives alone making up 39% of it. The common thread is that these protocols earn real fees and have a clear path for those fees to reach holders. In a more investable market, that’s the filter that matters.

The bigger picture is that value is moving up the stack. In the last 30 days, apps earned $563M in revenue versus $43M for chains, 11x more, and apps’ share of onchain revenue has gone from 41% in 2024 to 88% in 2026. Tokenization is pulling in institutions and consumer apps are pulling in users. With both trends running at once, the onchain ecosystem looks better set up heading into 2027 than it has in earlier cycles.
Collateral management is entering its next phase. Citi’s latest research argues the question is no longer whether digital collateral will emerge, but how institutions integrate it into existing optimization frameworks, infrastructure that’s programmable and round-the-clock, not bolted onto legacy rails.
For collateral specifically, tokenization changes three things: settlement speed, the breadth of eligible assets, and genuine cross-border mobility. The scenario that makes this concrete: a Friday evening margin call from a Tokyo counterparty. Under the traditional model, it sits open all weekend, post cash you’d rather deploy elsewhere, or accept counterparty exposure until Monday. With tokenized collateral, the asset and settlement token exchange simultaneously, no dependency on market hours.
RWA perps just became one of the fastest-growing products in crypto. Monthly trading volume on perpetual futures tied to stocks, gold and other traditional assets hit $117.3B in August, up 44x in a year. Open interest reached $4.8B.
These contracts give exposure to traditional asset prices without owning the asset. No expiry, and some venues trade 24/7, including weekends when stock exchanges and major commodity futures markets are closed.

What people trade has changed too. A year ago commodities were 84% of RWA perp volume. In August, equities were 48%, commodities 28% and indices 18%.

Open interest moved first. Equity OI passed commodities in June ($1.6B vs $1.2B), and equity volume followed a month later. By August, equity OI stood at $2.2B against $1.6B for commodities. Total OI grew nearly 30x, from $161M in July 2025 to $4.8B, and stayed near its record high even as volume pulled back from July's $145.1B peak (this is still small next to traditional derivatives, which trade in the tens of trillions per month).
The next question is whether RWA perps become a standard offering at traditional brokers and exchanges. One note on access: only one US-regulated venue is approved to trade a single perp today, and most exchanges restrict US persons from true perpetual futures.
