

Klimatologe/Climatologist @MeteoSchweiz, mainly sharing personal views on climate, earth science, data visualisation and visual art
Zürich, Schweiz
Joined November 2020
- Tweets84
- Following85
- Followers275
- Likes120






Pinned Tweet
About one third (2.8 Mio) of the Swiss population lives in a 5 km wide band along the SBB Intercity 1 train between St. Gallen and Geneva. My new contribution to @nzzfolio available in print on May 6. #DataViz #Switzerland #RStats #Education #DataScience
nzz.ch/folio/kartenspiele-ei…

Simon Scherrer 🏔️ 🚴 retweeted

Now here is an idea! Let’s turn Switzerland into a ball. Wouldn’t be forbiddingly tall either and could easily be parked in Idaho or Western Australia. Source: buff.ly/3YzioTS

„Switzerland as a sphere“. My new contribution to @nzzfolio. In print from Monday, 4 November.
#maps #Switzerland #dataviz
nzz.ch/folio/kartenspiele-so…
„Climate Island Switzerland“. My new contribution to @nzzfolio #DataViz #Switzerland #maps #Education #climate
nzz.ch/folio/klimainsel-schw…

My new @nzzfolio map is online and available in the July/August print magazine.
nzz.ch/folio/kartenspiele-in…
#dataviz #Switzerland #cities #maps

New paper out on the observed change of heavy #precipitation in #Switzerland. Lead: @vici_veni_vidi
@meteoschweiz #climatechange
linkedin.com/posts/simonsche…
Pretty crazy: The post about my @nzzfolio map below and the one of @Rainmaker1973 together got almost 2 Mio views in a bit more than one day.

Excellent geography trivia: One third of the population of Switzerland lives within 5 kilometers of the main train line crossing the country. Source: buff.ly/3WBdINQ

This year, I have the pleasure of realising some surprising views of Switzerland for @nzzfolio in the new "Kartenspiele" section. The first map has just been published online. The print version will follow on Monday, 4 March. t.ly/AV_0R

New @meteoschweiz / @KNMI study out to hopefully advance climate monitoring by introducing the concept of a current #climate mean using a simple time series smoother. #climatechange linkedin.com/posts/simonsche…
Repost for #30DayMapChallenge Day 29: Population. Population density map of #Switzerland. Data: @KonturInc Global Population Density (v2022.06.30). Drawn with #Rstats and #rayshader #DataVisualization

ALT A 3D map of population density of Switzerland
Fasziniert von den Landschaftsformen unserer Erde? Dann könnte sich ein Besuch meiner #Ausstellung im Ortsmuseum Hunzikerareal, Dialogweg 6, Zürich lohnen. #Relief #Zürich

37 (!) TOP10 Plätze warmer Monate, KEIN EINZIGER kalter TOP10 Platz in den letzten 10 Jahren in der Schweiz. Ich weiss nicht, wie man den starken #Klimawandel noch besser verdeutlichen kann. linkedin.com/posts/simonsche…

Wissenschaftliche Visualisierungen in Kirchenfenstern (hier Wärmeabstrahlung der Erde) sieht man auch nicht alle Tage #Mariendom #Linz #dataviz #church

ALT Visualisierung der Wärmeabstrahlung der Erde als Kirchenfenster im Linzer Mariendom
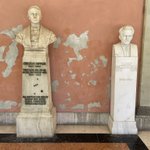
Heute kurzer Besuch im eindrücklichen Innenhof des Hauptgebäudes der Universität Wien und dabei auf diese zwei namhaften Physiker gestossen. #Doppler #Schrödinger

ALT Büsten der zwei Physiker Christian Doppler und Erwin Schrödinger im Innenhof des Hauptgebäudes der Universität Wien

Eine neue Studie von MeteoSchweiz zeigt, dass es aufgrund des raschen #Klimawandel bessere Methoden braucht, um die Klimaentwicklung und den aktuellen #Klimazustand zu beschreiben. Was das für unsere Klimaprodukte bedeutet, lesen Sie hier: bit.ly/44QuRDQ

📢In a new OA paper, we present a method for classifying temperature #extremes considering non-normal distributions, seasonality and climate change. An important step towards better climate monitoring in times of strong #climatechange @MeteoSwiss
📄🔗doi.org/10.1007/s00704-023-0…

ALT The figure shows that climate change has already made cold extremes in Switzerland noticeably rarer. A 3-day extreme cold event that occurred in spring 2017 would not have been an exceptional event in 1977 (40 years earlier).
Mein neuer Beitrag im MeteoSchweiz Blog:
Eine Klimareise durch die Schweiz🇨🇭
🔗Blog: meteoschweiz.admin.ch/ueber-…
📈Grafik D/E/F/I (PDF-Format): bit.ly/3q9urty
Sonnig und trocken oder wolkig und nass: Mit einer Karte, die jährliche Sonnenscheindauer und Niederschlag kombiniert, können wir einiges über das vielfältige #Klima der #Schweiz lernen. Kommen Sie mit auf eine Klimareise durch die Schweiz: bit.ly/3OxqTeu #Klimadaten

Animated view of the Everest region (🇳🇵/ 🇨🇳) with #MountEverest (8849 m, highest🏔️ on earth), #Lhotse (8516 m, forth highest🏔️) and #Makalu (8485 m, fifth highest🏔️).
Done with #Rstats using the #rayshader and rayvista packages. @EverestToday @tylermorganwall #maps
full resolution (Full HD) video file available here:
drive.google.com/file/d/1ATq…