

Make Beautiful Flow Diagrams. Also: https://xitter.cf/t.co/bV9uxOSNd9. Code: https://xitter.cf/t.co/tod1AtGPUg Tips: CashApp/Venmo “SankeyMATIC”
- Tweets354
- Following48
- Followers837
- Likes238





ALT A before & after comparison of a Job Search flow diagram made with mock data using SankeyMATIC. From left to right, the diagram shows a total of 17 Applications which flow into three separate nodes: 4 "No Answer", 9 "Rejected", and 4 "Interview". The "Interview" flow is broken down further as the job search process continues through more stages, ending in 1 offer Accepted and 1 offer Declined. In the 'before' version, all names and values in the labels are on the same lines and are shown at the same small size. In the 'after' version, the number value for each node is presented on its own line first (using a very large text size), and the name of the node is on a second line. The name's size is smaller than the value's, but it is still a larger text size than the 'before' image. Annotations on the 'after' image read: * "Values can be placed on their own lines." * "Values and names can be different sizes." * "This can make more room for your labels to be *larger* and more readable."

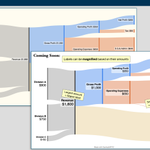
ALT A before & after comparison of a Financial Results flow diagram made with mock data using SankeyMATIC. In the diagram, 3 divisions (A, B, and C) join their revenue amounts into a single "Revenue" node with a value of $1,800, which is then split into Gross Profit ($1,000) and Cost of Sales ($800). Gross Profit is further broken down into smaller Expenses until a Net Profit of $260 remains. In the 'before' version, all names and values in the labels are on the same lines and are shown at the same small size. In the 'after' version, each name is shown first on its own line and the amount is on a second line using a larger text size. The key difference being shown is that each label's overall size is also scaled according to the amount it represents. Annotations on the image read: * "Labels can be *magnified* based on their amounts" * "Largest amount = largest label" (placed next to "Revenue", $1800) * "Smallest amount = smallest label" (placed next to "Amortization", $10)

ALT Screenshot showing two new buttons in the SankeyMATIC interface: "Save my work" and "Load from file". The new buttons are highlighted with a purple crayon outline and an 'eyes' emoji is looking at them from the side.


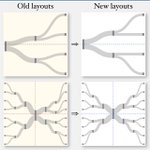
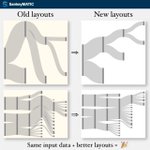
ALT 3 small example diagrams showing some of the new output capabilities of SankeyMATIC. The first example is a funnel where the initial nodes lose value and converge on a single final node. The second is an image where one node splits into two child flows; the top child node splits into two more child flows; then the top grandchild splits into two more flows. The third is a binary tree showing 8 elements collapsing down to one and then splitting into 8 nodes again on the far end. Each type of image will be referenced in the thread below.