

📈 Institutional Activity Scanner for Indian Stocks 🧠 Data-Driven Research & Smart Money Insights 🚀 Helping Traders Make Better Decisions
SMF DATA DETAILS 👉
Joined February 2025
- Tweets5.1K
- Following122
- Followers7.9K
- Likes6.3K






Pinned Tweet
#GMBREW
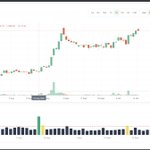
Smart Money Footprints don’t lie 📊
After this signal, the move was 🔥 I track real data-driven footprints that show where Smart Money is flowing, and it works.
If you want To Know such stocks before Repost + comment “SMF,” I’ll DM you the full details.
#smartmoney #smartmoneyfootprint #smfdata #smf #StockMarket #gmbrew #GMBreweries

Recently, I travelled Delhi to Mumbai for a traders & manufacturers event.
There, I met a guy who supplies cosmetic chemicals to big companies.
I asked him: “If companies can buy directly from manufacturers at cheaper prices, why do they buy from you?”
He smiled and said: ↓↓↓
He smiled and said: “Because manufacturers make only specific chemicals.
We deal with multiple manufacturers and supply everything a company needs.”
Basically, one supplier instead of dealing with 10–20 manufacturers.
Then he dropped the number: ₹32 crore earned in the last 3 years.
I asked, “What does it take?” “₹15–20 lakh capital.
Because this business runs heavily on credit.”
And his target?
Big companies that manufacture their own products — because they constantly need raw materials.
That conversation taught me something: You don’t always need to make the product. Sometimes, being the bridge is the business.
What's your take?

#CYIENT
Data + Chart 🔥🔥🔥
How many of you are tracking? #stockmarket

The market gives you two choices every day:
Follow the price. Or follow the money.
Most people choose the first one because it is visible. The second one is quieter, but it usually moves first.
If you want to start seeing the second one clearly,
Comment “SMF”.
#SmartMoney #SMFdata
In 2008, a young investor watched the market crash 60%.
Everyone around him was selling.
His father told him one thing:
The market is not dying. The people who bought it are dying.
He did not understand it then.
He understood it 15 years later.
What did his father actually mean?
↓↓↓↓↓
He meant that a crash does not destroy companies. It destroys the people who cannot hold them.
In 2008, the same banks, the same cement companies, the same pharma businesses were still operating.
The factories were still running. The customers were still buying.
Only the owners changed.
The people who sold at the bottom handed their shares to the people who stayed.
That is how wealth transfers in every crash: not from rich to poor, but from impatient to patient.
The 2008 crash is the best example.
Nifty fell from 6,300 to 2,500.
Retail investors who had entered in 2007–08 sold in panic. The ones who held through 2009–2010 saw the market double from the bottom.
The lesson is not to buy every crash.
The lesson is: know why you bought before the crash starts.
If your reason is still valid when the price is down 40%, you hold.
If your reason was only that it was going up, you were never an investor; you were a passenger.
Most people who lost in 2008 did not lose because they picked bad stocks.
They lost because they had no reason to stay when the reason to buy disappeared.
Have you ever sold in a crash and later regretted it?
Comment below.
#SmartMoney #SMFdata #IndianStockMarket
A trader saw the higher open and bought immediately.
He said the market had turned.
He did not check Friday’s flows.
He did not check whether institutions were still selling.
By afternoon the early gains were gone.
He was already in a small loss and confused.
The open creates emotion.
The data creates the plan.
Have you ever bought a higher open and watched it fade?
Comment Yes or No.
#SMFdata #IndianStockMarket
A trader in 2022 had one rule.
If a stock fell 15%, he would buy more.
He called it courage.
Friends called him a long-term investor.
He never checked who was selling.
In one mid-cap, the fall started slowly. First 12%. Then 20%. Then 35%.
Every drop looked like a bargain. So he added. Then added again. His average improved on paper. His capital did not.
For six months the stock stayed weak. No news. No recovery. Just lower lows.
He kept telling himself, “Quality always comes back.”
What he missed was simple.
While he was buying every dip, institutions were reducing.
Delivery was rising on down days because retail was absorbing the supply.
The chart looked cheap. The ownership data did not.
By the time he stopped averaging, the stock was down another 40% from his last buy.
He finally exited with close to a 70% loss on that position.
The painful part was not the loss.
Three quarters later, the same stock started a real move.
This time the data had changed.
Institutional holding was rising.
Down days were being absorbed by stronger hands, not by trapped retail.
He was no longer in it.
He had used all his patience in the wrong phase.
That is the expensive lesson.
Averaging down is not a strategy. It is a habit.
It works only when the people on the other side are accumulating. It destroys capital when they are leaving and you are the exit.
Cheap price is not the same as Smart Money buying.
Before you add to a falling stock, check one thing: who is still willing to own it?
Have you ever averaged down and later realised institutions were selling the whole time?
Comment yes or no.
#SmartMoney #SMFdata #IndianStockMarket
Every few months, a stock "gets added to Nifty Smallcap 250."
Retail reaction: "Index inclusion! Buy karo!"
Here's what actually happens 👇
The mechanism nobody explains:
1️⃣ Nifty rebalances twice a year (March & September).
Based on 6-month average market cap + liquidity.
2️⃣ When a stock enters an index, PASSIVE funds that track that index MUST buy it.
Not optional. Not based on fundamentals. Just mandatory rebalancing.
3️⃣ For Nifty Smallcap 250, the forced buying flow is typically $5-15 million per stock (depending on weight).
4️⃣ This happens on ONE specific day — the rebalance effective date.
Not before. Not after.
What retail keeps misreading:
⚠️ Lesson 1: Inclusion ≠ Business improved
Zero change in revenue, margins, orders, or management.
Just a technical index tweak based on past market cap.
⚠️ Lesson 2: The rally is FRONT-LOADED
Smart money starts buying 4-6 WEEKS before inclusion (anticipating passive flow).
By the time news hits headlines, 60-70% of the move is DONE.
⚠️ Lesson 3: The post-inclusion drift
Many stocks that enter an index UNDERPERFORM 3-6 months later.
Why? The passive buy is one-time. No fresh demand after.
Fundamentals have to carry the stock from there.
⚠️ Lesson 4: Removal is the opposite
When a stock EXITS an index, passive funds must SELL.
Equally mandatory. Equally mechanical.
This is why some stocks crash 20-30% in a week around removal dates.
What to actually watch:
📍 Rebalance pre-announcement date (not the effective date)
📍 Weight of stock in index (bigger weight = bigger flow)
📍 Delivery % trend 4-6 weeks pre-inclusion (smart money footprint)
📍 Business fundamentals (will they justify the new valuation?)
📍 Post-inclusion 90-day price action (the real test)
The lesson:
Index inclusion is a PLUMBING event.
Not a fundamental event.
Trade it with that lens.
Save this for the next inclusion story 📌
(Educational only. Not investment advice. DYOR.)
#Nifty #StockMarket #SmallCap #smfdata
A trader had a stock that was up 40%.
Friends told him to book profit.
Twitter said the stock looked expensive.
He sold.
Three months later, the same stock was up another 80%.
Data later showed institutions were still buying when he exited.
He did not lose because the stock was bad.
He lost because he followed noise instead of the footprints.
Have you ever sold a winner too early just because people around you were booking profit?
Comment Yes or No with stock name
#SmartMoney #SMFdata #IndianStockMarket
New Website and Screener for SMF data are almost ready
By this weekend will share access with all existing members
You will get all videos linked in the format within your dashboard, with all tool indicators and everything

Something historic is happening in Indian markets 📊
FPIs just set a RECORD.
The number nobody's framing properly 👇
2026 YTD FPI outflows: ₹3+ LAKH CRORE
2025 full-year FPI outflows: ₹1.66 LAKH CRORE
That's +57% MORE outflow in 9 months than ALL of last year.
The breakdown:
📊 September alone: ₹35,860 CR sold (highest since April)
📊 Oct 1 alone: ₹9,232 CR out
📊 Oct so far: ₹18,513 CR out
📊 Nifty YTD: -14% (worst since 2011)
📊 Sensex YTD: -15.5%
Why FPIs are running:
✅ US 10-year yield at 5.29% (risk-free money)
✅ Dollar strength crushing EM returns
✅ Crude pressure on India's current account
✅ Weak rupee eating foreign returns
✅ US-Iran geopolitical stalemate
What retail keeps missing 👇
⚠️ Point 1: FPI outflow ≠ Indian market collapse
Despite ₹3 lakh crore outflow, Nifty only down 14%.
Historically that scale of FPI exit = 25-30% crash.
Why hasn't it happened?
Point 2: DIIs are the invisible army
SIP flows: ~₹25,000 Cr/MONTH
Domestic insurance + MF inflows absorbing the sell pressure
This is a structural shift most retail still hasn't registered
Point 3: FPIs don't exit India permanently
Look at Oct 2022-March 2023: ₹1.17 lakh Cr OUT
Then April 2023-Jan 2024: ₹2.5 lakh Cr IN
When the US yield cycle cools, flows reverse FAST
What to actually watch next:
📍 US 10-year yield — if it cracks below 5%, flows return
📍 Rupee stability (needs to hold 85-86 zone)
📍 Crude trajectory (below $90 = relief)
📍 Q2 FY27 results (fundamentals vs sentiment gap)
📍 DII absorption capacity (SIPs stay sticky or wobble?)
The lesson:
Panic headlines sell newspapers.
Pattern recognition builds portfolios.
FPI exits are a CYCLE, not an ending.
Save this 📌
(Educational only. Not investment advice. DYOR.)
#FPI #Nifty #StockMarket #Sensex #smfdata
A trader with a 40% win rate outperforms
A trader with an 80% win rate.
⬆️ Read that again.
Win rate gets attention.
Risk-to-reward gets paid.
Charts show the move.
Data often shows the move earlier.
Do you enter after confirmation, or after Smart Money activity?
Vote + tell why
👇👇👇👇
#IndianStockMarket #SMFdata
25%A) After breakout
19%B) After data
56%C) Mix of both
16 votes • Final resultsA trader kept a diary for 1 year.
Every trade had 3 lines:
• Why I entered
• What the data showed
• Why I exited
At the end of the year, he found something uncomfortable.
His best trades were the boring ones.
His worst trades were the exciting ones.
What does that tell you about most losses?
They often come from emotion, not from a lack of tips.
The boring trades had clear institutional activity.
He entered without hurry.
He exited with a plan.
The exciting trades came from:
• A sudden tip
• A sharp candle
• Fear of missing out
Those trades felt smart in the moment.
They were expensive by December.
If a trade needs excitement to look attractive, it is usually weak.
If a trade looks slow but the data is clean, it may be the stronger setup.
Write fewer trades.
Write better reasons.
What caused more damage for you last year boredom or FOMO?
Comment below. 👇
#SmartMoney #SMFData #IndianStockMarket
NSE listed at ₹1,800 four days ago.
Today it's at ₹1,761.
Below the IPO price of ₹1,785.
Retail's reaction: "Loot ho gayi!"
Here's what actually happened 👇
The timeline:
📅 Sept 24: Listed at ₹1,800 (0.84% premium)
📅 Sept 24: Peaked at ₹1,878 (+5.2%)
📅 Sept 24: Closed at ₹1,818
📅 Sept 28 (today): Low of ₹1,761 (-1.34% vs IPO)
Market cap erased in 2 sessions: ~₹12,000 CRORE.
Why it happened:
✅ Sensex weak on rising US bond yields
✅ Crude spiking (US-Iran stalemate)
✅ Broader profit booking
✅ Listing gains getting cashed in
The 3 things retail keeps missing about IPO listings 👇
⚠️ Lesson 1: Listing pop ≠ business quality
NSE is India's LARGEST exchange (78% revenue from transactions).
Fundamentals unchanged in 4 days.
Only sentiment changed.
⚠️ Lesson 2: The "sure-shot IPO" is a myth
Same script we've seen with:
- LIC (still below issue price years later)
- Paytm (-75% from listing)
- Vedanta subsidiaries (Aluminium hit lower circuit day 2)
- Now: NSE below issue price in 4 days
Not every IPO = automatic winner.
⚠️ Lesson 3: The BIG picture nobody's connecting
Remember August?
SBI + SBI Capital diluted just 1% in NSE at ₹30,000 Cr IPO valuation.
They didn't sell more.
Now the stock is below issue price.
Someone read the setup correctly BEFORE the listing.
What to watch next:
📍 Where NSE finds support (₹1,700? ₹1,650?)
📍 F&O turnover trends (78% of revenue = the real driver)
📍 Anchor investor 30-day lockup expiry
📍 How BSE reacts (competitor pricing)
📍 Q2 results (real fundamentals, not sentiment)
The listing week noise passes.
The business fundamentals stay.
Study which one you're trading.
Save this 📌
(Educational only. Not investment advice. DYOR.)
#NSE #IPO #StockMarket #smfdata
NSE listed today after a $2.4 billion IPO.
Issue price: ₹1,785
Listing: ~₹1,800
That’s barely a 1% listing pop.
For weeks, the conversation was all about GMP and listing gains.
Then the listing happened—and the easy headline disappeared.
So what should investors actually watch now?
↓↓↓↓
Not the first 30 minutes.
This was an Offer for Sale of ~₹22,560 crore, meaning existing shareholders sold their shares. NSE did not raise fresh capital through the IPO.
Subscription told another story:
• QIB: 12.68x
• NII: 6.55x
• Retail: 1.39x
Institutional demand was much stronger than retail participation.
The listing was muted compared with the hype.
But that doesn't automatically make NSE a bad stock.
And a strong listing pop wouldn't automatically make it a good buy.
From here, watch:
Does delivery remain strong after Day 1?
Are institutions holding or booking listing profits?
How does NSE's valuation compare with listed peer BSE—not just the GMP?
Retail watches the debut.
Smart Money watches what happens over the next 10–20 sessions.
What’s your read on NSE after listing: hold, watch, or ignore the noise?
Comment below 👇
#NSEIPO #NSE #SmartMoney #SMFData