

Power BI for ecommerce & retail. One-page KPIs + 3 decisions for this month. Async, written only.
Joined April 2015
- Tweets16
- Following609
- Followers17
- Likes7

Pinned Tweet
Your bestseller is often the product that makes you the least money.
A revenue-only dashboard won't show that. Margin and repeat rate will.
If you only checked 4 numbers a week, would revenue still be first?
7
I'll look at your ecommerce orders for free and send back the 3 decisions I'd make this month.
Send a 90-day order export. No passwords, no calls. Back in 72 hours, each decision with the numbers behind it.
If you know the questions, you don't need a 12-page report.
1
Four weekly numbers I'd keep: revenue, orders, repeat rate, and margin after fees, shipping and ads.
Not sessions. Not a 20-page report. Eight weeks of those four usually shows if the business is getting healthier.
Which of the four do you trust least today?
#ecommerce
1
33
Returns don't just reverse revenue. They reverse a sale you already paid to acquire, pack and ship.
A refund-only view makes margin look better than it is. Add inbound shipping and the ad cost you can't recover.
Which of your top 10 SKUs has the highest return rate?
#ecommerce
1
9
A holiday sales forecast is not a stock plan.
If you only plan from revenue, you'll refill the items that shout the loudest, and the quiet high-margin ones will run out first.
Rank SKUs by days of stock and contribution, then buy. Revenue can wait its turn.
#ecommerce
4
ROAS can look healthy while the product loses money.
It usually ignores discounts, shipping, returns and payment fees.
In the model, show contribution after ads, not just return on ad spend. If that number is thin, scaling the campaign just scales the loss.
#PowerBI #ecommerce
11
Excel to Power BI, before vs after:
Before: 3 CSV exports, a VLOOKUP sheet, 2 hours every Monday, and numbers that depend on who built them.
After: one model, scheduled refresh, one definition of revenue.
The win isn't speed. It's arguing about decisions, not numbers.
#PowerBI
11

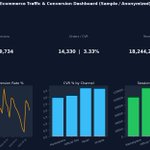
I build Power BI KPI dashboards for ecommerce & retail teams: revenue, orders, AOV, traffic, conversion rate, channel & product insights.
Delivered in 5-10 days, all communication in writing.
Fiverr: fiverr.com/ronhsiao/create-a…
Upwork: upwork.com/freelancers/~0185…
#PowerBI

1
56