

Exploring, and communicating, the science of #rewilding | Tweets by @Nature_Based, @Painting_Nature, @DandoTom, @TrotmanCharlie and @OwenMiiddleton |
- Tweets3K
- Following17
- Followers1.9K
- Likes127



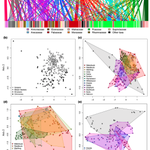


ALT Dietary niche overlap among large-herbivore species and feeding guilds. (a) Bipartite plant–herbivore interaction network. Lines connect the 14 herbivore species (top) to dietary plant mOTUs (bottom, coloured by plant family). Widths of upper boxes reflect the number of samples analysed for each species; widths of lower boxes reflect the relative abundance of each plant mOTU across all samples in the dataset; and widths of connecting lines reflect the relative read abundance of each mOTU within the diet of each species. We show only connections representing ≥1% of each species’ diet (total n = 74). (b) Non-metric dimensional scaling (NMDS) ordination of Bray–Curtis dietary dissimilarity among the a priori feeding guilds listed in Table 1 (stress = 0.16; perMANOVA, pseudo-F3,289 = 12.91, r2 = 0.12, p < 0.001). (c) NMDS ordination of Bray–Curtis dissimilarity among species (same ordination as in panel b, but coloured by species to show community-wide interspecific diet dissimilarity...

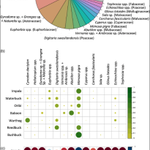
ALT Availability, utilization, and selectivity of common floodplain plant taxa. (a) Relative availability (proportional areal cover) of the 14 plant taxa representing at least 1% of total plant cover (collectively accounting for >96% of cover). (b) Proportional contribution of each plant mOTU to the diet of each ungulate species; circle size and colour reflect relative read abundance. (c) Jacob’s D selectivity index for each plant taxon, ranging from −1 (strongest avoidance, red) to 1 (strongest selection, blue). Plant taxa sharing the same barcode in the local reference database were combined for the purposes of this analysis
