

Through objective analysis, we study what issues affect farm and rural finances and how policy decisions influence outcomes in U.S. farm and rural communities.
- Tweets294
- Following192
- Followers307
- Likes360
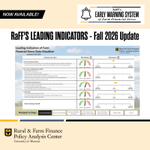




ALT Promotional graphic for RaFF’s Early Warning System of Farm Financial Stress. A banner reading “NOW AVAILABLE!” appears above the headline “RaFF’S LEADING INDICATORS – Fall 2026 Update.” The center of the image shows a dashboard screenshot titled “Leading Indicators of Farm Financial Stress Data Visualizer, Updated Fall 2026,” with risk gauges and momentum indicators for categories including farmer and banker sentiment, farm income and balance sheet health, farm machinery market dynamics, and credit quality. The Rural & Farm Finance Policy Analysis Center and University of Missouri logos appear on the dashboard and at the bottom of the graphic. The design uses black, gold, gray, and cream colors.

ALT Graphic promoting a new RaFF policy brief titled “Higher Income, Lower Liquidity: Financial Stress Signals Among Iowa Farms in 2025.” The graphic includes a stacked bar chart showing the distribution of Iowa farms by liquidity rating from December 2016 to December 2025. Over time, the share of farms rated financially vulnerable (red) declines from about 22% to 19%, while the share rated strong (green) generally increases, reaching around 41% in 2023 and remaining above 34% in 2025. At the same time, the proportion of farms with no current liabilities (gray) remains relatively stable at roughly 36% to 45%. The chart illustrates that despite higher farm incomes, liquidity challenges persist for many farms. The graphic is branded with the Rural & Farm Finance Policy Analysis Center at the University of Missouri.

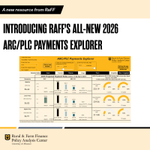
ALT Promotional graphic for the Rural & Farm Finance Policy Analysis Center at the University of Missouri announcing “RaFF’s All-New 2026 ARC/PLC Payments Explorer.” The image features a large headline above a screenshot of the online tool, which allows users to select a county, crop, and irrigation system and view projected 2026 ARC and PLC farm program payments. The dashboard example displays data for Boone County, Iowa, corn, non-irrigated acres, with payment scenarios, charts, and gauges comparing projected yields and payments. RaFF and University of Missouri branding appears at the bottom of the graphic.

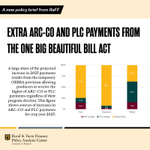
ALT Graphic promoting a Rural & Farm Finance Policy Analysis Center policy brief titled “Extra ARC-CO and PLC Payments from the One Big Beautiful Bill Act.” The graphic explains that a large share of projected payment increases in crop year 2025 comes from a temporary provision allowing producers to receive the higher of ARC-CO or PLC payments regardless of their program election. A stacked bar chart shows sources of payment increases for corn, soybeans, and wheat. For corn, increases are 15% from ARC change, 11% from PLC change, and 74% from the special rule. For soybeans, increases are 3% from ARC change, 5% from PLC change, and 92% from the special rule. For wheat, increases are 16% from ARC change, 47% from PLC change, and 37% from the special rule. The University of Missouri Rural & Farm Finance Policy Analysis Center logo appears at the bottom.

ALT Graphic from a Rural & Farm Finance Policy Analysis Center policy brief titled “Extra ARC-CO and PLC Payments from the One Big Beautiful Bill Act.” The graphic explains that projected 2026 payments are evaluated under three enrollment scenarios and compares national projected ARC-CO and PLC payments under the FB18 baseline and OBBBA, along with the additional payments generated by OBBBA.


ALT Promotional graphic for a RaFF policy brief. Large black text on a light gray background reads, “Lender Costs, Market Structure and Farm Loan Rates.” Smaller italic text below states, “How changes in cost of funds affect ag loan interest rates.” A black banner in the upper left corner says, “A new policy brief from RaFF.” The Rural and Farm Finance Policy Analysis Center and University of Missouri logos appear in the lower left corner, with gold, gray, and black accent bars along the bottom edge.

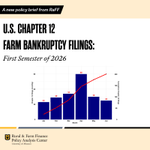
ALT Promotional graphic for a RaFF policy brief titled “U.S. Chapter 12 Farm Bankruptcy Filings: First Semester of 2026.” The graphic features a bar and line chart showing monthly U.S. Chapter 12 farm bankruptcy filings from January to June 2026. Monthly filings are 23 in January, 29 in February, 34 in March, 60 in April, 30 in May, and 25 in June, for a cumulative total of 201 filings by midyear. The Rural & Farm Finance Policy Analysis Center and University of Missouri logos appear at the bottom.

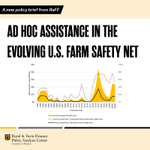
ALT Cover image for a University of Missouri Rural & Farm Finance Policy Analysis Center (RaFF) policy brief titled “Ad Hoc Assistance in the Evolving U.S. Farm Safety Net.” The design features large black headline text on a light gray background above a chart showing U.S. ad hoc farm assistance payments from 1998 to 2025, with a sharp spike around 2020. A banner at the top reads “A new policy brief from RaFF,” and the University of Missouri Rural & Farm Finance Policy Analysis Center logo appears at the bottom.

ALT Promotional graphic announcing RaFF's Leading Indicators Data Visualizer, part of the Early Warning System of Farm Financial Stress. The image features a screenshot of an interactive dashboard displaying farm financial stress indicators, risk rating gauges, and momentum metrics. Rural & Farm Finance Policy Analysis Center and University of Missouri branding appears at the bottom.


ALT Graphic from the University of Missouri Rural & Farm Finance Policy Analysis Center announcing a job opening for an EWS Project Lead (Job ID: 60277). The position supports development of the Early Warning System of Farm Financial Stress (EWS). Key responsibilities listed include coordinating EWS implementation, engaging with agricultural stakeholders, monitoring local conditions affecting farm financial stress, and developing decision-support materials. The posting notes full benefits eligibility and directs applicants to hr.missouri.edu. The design features MU gold and black branding on a light gray background with a gold patterned accent along the right side.

ALT Graphic announcing two newly published reports from the Rural & Farm Finance Policy Analysis Center (RaFF) at the University of Missouri. A banner at the top reads “Two reports just published” above the RaFF Early Warning System of Farm Financial Stress logo with a bell icon. The graphic lists: “Leading Indicators: Summer 2026” (RaFF Report EWS-2026-4) and “Consensus Report for Missouri” (RaFF Report EWS-2026-3), each preceded by a right-pointing arrow. University of Missouri Rural & Farm Finance Policy Analysis Center branding appears at the bottom. Beige, light gray, black, gold, and blue-gray color scheme.

ALT Graphic promoting a new paper from the Rural & Farm Finance Policy Analysis Center (RaFF) at the University of Missouri titled, "Temporary Programs, Lasting Questions: Ad Hoc Assistance in the U.S. Farm Safety Net" published in Applied Economic Perspectives & Policy. The graphic features a chart of U.S. ad hoc farm payments from 1998–2026F. A yellow area graph shows ad hoc payments in billions of real 2026 dollars, with major spikes around 2020–2021 and again in 2026F. Two overlaid lines show ad hoc payments as a share of total government payments and as a share of net farm income. The RaFF and University of Missouri logos appear at the bottom left.

ALT A graphic from the University of Missouri Rural & Farm Finance Policy Analysis Center announces a new policy brief titled “Spring 2026 Farm Income Outlooks Review.” The graphic states the brief summarizes top data points for 10 states—Missouri, Arkansas, Illinois, Indiana, Iowa, Kansas, Minnesota, Nebraska, North Dakota, and Texas—and includes a row of small photos showing agricultural scenes such as livestock, corn, a bank building, soybeans, and pigs.

ALT Graphic announcing a new report from the Rural & Farm Finance Policy Analysis Center titled ‘Leading Indicators of Farm Financial Stress: Spring 2026.’ The image includes RaFF’s Early Warning System logo and a gauge labeled ‘Farm Economy Overall’ showing a value of 5.4, positioned between low risk and high risk.

ALT The Rural & Farm Finance Policy Analysis Center invites you to register to join a Webinar on the Spring 2026 Farm Income Outlook for Missouri. The webinar will take place on Tuesday, May 5, at noon Central daylight time.

ALT Graphic from the University of Missouri Rural & Farm Finance Policy Analysis Center announcing “Spring 2026 Farm Income Outlook for Illinois.” A headline notes that Illinois net farm income is projected to increase by 11% in 2026. A waterfall chart compares net farm income in 2025 at $5.27 billion to 2026 at $5.87 billion, showing decreases from crop receipts, livestock receipts, crop insurance indemnities and production expenses. Losses are offset significantly by increased government payments and other changes that are minimally positive.