

RSEC is open access peer-reviewed journal for novel, multidisciplinary research at the interface between remote sensing science & ecology and conservation
- Tweets1.4K
- Following133
- Followers4.1K
- Likes334






ALT (A) Input image, (B) output from the segmentation model used to infer a bounding box and body contour for each whale, (C) output from the keypoint detection model used to infer a bounding box and the axis for each whale and (D) final output by combining the outputs of both the models and calculating the widths along the axis at 5% intervals.

ALT Remotely sensing coral bleaching in the Jeddah reef (Saudi Arabia) and mapping their severity levels. (A) and (B) RGB composite images acquired on October 3, 2023. (C) RGB image was acquired on January 22, 2020. (D) Coral bleaching map based on the least-squares approach on October 3, 2023 in the Jeddah region. (In (D) HB, high bleaching; LB, low bleaching; MB, moderate bleaching; NB, no bleaching; the white triangle indicates the sampling location highlighting the presence of a moderate bleaching event).
ALT Remotely sensing coral bleaching in the Jeddah reef (Saudi Arabia) and mapping their severity levels. (A) and (B) RGB composite images acquired on October 3, 2023. (C) RGB image was acquired on January 22, 2020. (D) Coral bleaching map based on the least-squares approach on October 3, 2023 in the Jeddah region. (In (D) HB, high bleaching; LB, low bleaching; MB, moderate bleaching; NB, no bleaching; the white triangle indicates the sampling location highlighting the presence of a moderate bleaching event).


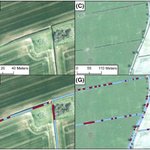
ALT Examples of classified aerial imagery before (A–D) and after (E–H) hedgerow identification. Hedgerow boundaries were classified in 30 m segments to reduce processing time. Contains imagery provided by Getmapping

ALT Result of the oil palm layer using the U-Net model and product fusion (A) High-resolution satellite image (B) A predicted IOP and SOP oil palm extent in Democratic Republic of Congo.

ALT (A) Radial heatmaps of manatee daily acoustic activity for the years 2021 and 2022. The color scale is based on the presence count, that is, the number of segments with detections grouped by hour (see Methods section 2.5). Values on the y-axis are dates in format MM-DD. Gray areas represent absence of data. (B) Histograms of the manatee acoustic detections representing the cumulative number of segments with detections grouped by hour of the day for the years 2021 and 2022.

