

Empowering traders with Quant & AI skills. 📈
India
Joined October 2012
- Tweets19.2K
- Following1.7K
- Followers14.1K
- Likes2.8K


Pinned Tweet
1 nanosecond in HFT, stretched to 1 second, makes a blink of an eye last about 10 years.
Sameer Kumar (iRage), Stefan Jansen (@ml4trading), @G2GAjaySharma, Tony Lee (Alpaca) and Mridul Arora (Elevation Capital) at our Algo Trading Conference 2026 👇
#AlgoTrading #HFT #QuantTrading
A reviewer gives your quant GitHub about two minutes. They're rarely looking at the returns.
They're checking whether you handled the boring parts, because the boring parts are the job:
• Data source and date range stated
• Rules written down before the test
• Costs and slippage applied
• A test period you never touched while building
• A README that says what you'd do differently
Six projects that give a reviewer something to ask about:
1. Momentum on 50 stocks, run on today's index members and on point-in-time members
2. A pairs trade, plus the test that showed when the pair broke
3. A backtester that handles splits, dividends and missing days
4. An options P&L explained day by day through its Greeks
5. A limit order book simulator in C++ or Python
6. A cost study: how much edge a simple strategy needs to survive fees
Three finished projects beat nine certificates. And a failed backtest, written up properly, is often the best one to show.
What does a quant trader actually do all day?
The algos place the trades. The day goes on checks: positions vs the broker, every fill, a lookback tweak that failed out of sample, one strategy at 92% of its risk limit.
A simulated desk day in 54 seconds.
October has a reputation. 1929, 1987, 2008: the crashes people remember are October crashes.
We checked the S&P 500 since 1950, 921 months.
October does hold the two worst months on record: -21.8% in 1987 and -16.9% in 2008. It also has the most days with a fall of 3% or more: 20 of them.
But the average October gained 0.9%, and the index rose in 45 of 76 Octobers.
The month with the weak record is September. Average -0.6%, and the only month the S&P 500 fell more often than it rose: up in just 34 of 77 years.
So October is the month of big days, not bad months. One is a volatility problem and the other is a return problem, and they call for different questions about a portfolio.
Which month did you expect to be worst?
Data: S&P 500 price index via Yahoo Finance, Jan 1950 to Sep 2026, no dividends. History, not a forecast. Not advice.

Nifty has fallen 8 weeks in a row, its longest losing streak since 2001. Week 9 is still in the balance.
Oil is up 25% since early August. The US government's 10-year borrowing rate is the highest since 2007. The rupee is near its weakest ever, and on Wednesday the RBI raised rates for the first time since 2023. When every headline points the same way, selling starts to feel like the safe choice.
So we checked what that choice has usually cost.
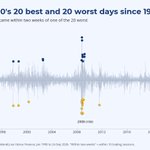
All 10 of Nifty's best days since 2007 came when it was already 19% or more below its peak. Big up days tend to land right next to big down days (13 of the 20 best came within 10 trading days of one of the 20 worst), so whoever steps out to "wait for clarity" usually misses the rebound along with the fall.
In rupees: ₹1 lakh in Nifty in Sep 2007 grew to ₹4.97 lakh by Thursday. Miss the 10 best days and it was ₹2.36 lakh. (Price index only, dividends ignored.)
None of this means the fall is over. In 2008 a 15% drop kept going to nearly 60%. That's the case for rules over hope. Size positions so a 20% fall won't force you out. Decide your exit before the bad week, not during it.
Not investment advice.

France now pays more to borrow than Greece or Italy.
Its 10-year bond yield went from below zero in 2020 to nearly 5% last week.
Many headlines say this will spread to the US. We checked 26 years of data. Short thread.

What this means:
France is the loudest story. On the data so far, it is not the main thing pushing US yields up. High inflation and heavy borrowing everywhere look like bigger drivers.
A quant interview is usually four interviews wearing one name. Most people prepare for one of them.
1. Online test
Timed maths and probability. Some firms run a mental arithmetic test where speed counts as much as accuracy.
Prep: 15 minutes of mental maths a day, for weeks, not the night before.
2. Probability and puzzles
Expected value, conditional probability, a dice or card game, sometimes a betting game where you have to quote a price.
Sample: a family has two children and at least one is a boy. What's the chance both are?
3. Your project
They pick one line on your CV and go three levels deep. Why that data? Why that test period? What would make it wrong?
Prep: name the limitation before they find it.
4. Code
Usually less about clever algorithms and more about whether your logic survives an edge case: a missing price, a holiday, a duplicate timestamp.
Round 3 is the one people under-prepare, and it carries the most signal.
Save this for your next interview.
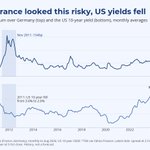
France now pays more to borrow than Greece, and the US 10-year closed Monday at 5.31%, its highest since 2002. The easy story is contagion from Paris. We checked 26 years of data, and historically US yields have moved with the global rate cycle far more than with France's own risk.
France's 10-year closed at 4.94% on Friday, its highest since at least 2008.
We split France's yield into two parts: Germany's yield (mostly the global rate cycle) and France's premium over Germany (France's own fiscal risk, about 140bp now, the widest since 2012).
Then we compared monthly changes, 2000 to 2026. US yields move with the German part (correlation 0.80) and barely at all with the French premium (-0.10).
2011 shows why. France's premium jumped from 54bp to 154bp between June and November. The US 10-year fell from 3.0% to 2.0% over the same months, partly because of safe-haven buying of Treasuries (the Fed was also easing).
This year both are rising. From January to Friday's close the French 10-year rose about 1.4 points; roughly half of that is Germany rising too. The US 10-year is up about 1.1 points, and nearly half of that came in the last five weeks, the same weeks France's premium jumped. Our monthly data runs to August, so it can't separate the two yet.
In 2011 a French scare came with falling US yields. A rise this time fits shared drivers better: high inflation and governments everywhere borrowing more. France is the loudest story; on the evidence so far it doesn't look like the main driver of US yields.
Caveats: monthly data hides moves within a month, and a forced seller in one big market can still spill over through funds that hold both. History, not a forecast.
Education, not advice. Bond prices fall when yields rise.

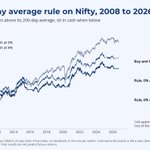
Sell Nifty when it closes below its 200-day average. Buy back when it closes above.
We tested it from July 2008 to September 2026.
Worst fall since July 2008: -45% for buy and hold, -26% with the rule.
Return a year: 10.1% for buy and hold, 5.9% with the rule.
So it took out about 40% of the worst fall and cost about 4 points a year. 144 switches, out of the market 29% of the time.
If your cash earns 6% while you're out, the rule's return rises to 7.6% and the worst fall is -22%. Still behind buy and hold on return.
A rule that cuts drawdown isn't free. The useful question is whether you'd have sat through -45% without one.
Data: Nifty 50 price index, no dividends, 0.1% cost per switch, before tax. Hypothetical backtest, not advice.

Friday's interview question: roll a die and take that many rupees, or reroll once and take the second number. What's it worth?
Answer: ₹4.25.
A second roll is worth 3.5 on average. So keep a first roll of 4, 5 or 6, and reroll a 1, 2 or 3.
Half the time you keep, and those average 5. Half the time you reroll, and that averages 3.5. (5 + 3.5) / 2 = 4.25.
Why interviewers ask it: the reroll is an option. It adds 0.75 to a single roll's value, and you only use it when the first outcome is bad. That's the same thinking behind pricing any choice you get to make later.
The follow-up they'll ask next: what if you get two rerolls? Try it in the replies.
A quant trader, a quant researcher and a quant developer sit ten metres apart. Their Tuesdays look nothing alike.
Trader
08:45 check overnight positions and limits
09:15 market opens, watch fills and P&L live
11:30 a spread widens, decide whether to cut size
15:30 close, explain any loss past the day's limit
Researcher
10:00 one idea, write the test
12:00 the test says no
14:00 work out why it said no
17:00 write it up, so nobody repeats it in six months
Developer
08:30 did the data land, did every job run
11:04 one symbol stops ticking, find out why before the trader notices
14:00 code review on the order gateway
18:00 ship the fix after the close, never during
Same firm, three different days. Which one would you want, and why?