Testing trading strategies with data, not hype. πŸ“Š Backtests & strategy breakdowns πŸ“ˆ Options research & market analysis πŸ’Ή Transparent futures journal

DataRoom
Joined October 2026
# I backtested the Opening Range Breakout from YouTube on 5.5 years of Nasdaq data **Video:** [Opening Range Breakout Backtested on 5 Years of Nasdaq](youtu.be/U8q3PZ0qbwk) **The strategy:** The first 15 minutes after the open (9:30–9:45 ET) set a high and a low. Go long when price breaks above, short when it breaks below. The video claims it loses money unless you only trade mornings with a wide opening range. **How I tested it:** - 1-minute QQQ data, regular trading hours, Jan 2021 – Jun 2026 - One trade per day: the first breakout - Stop at the other side of the range, otherwise exit at the close - Converted to 1 MNQ contract, $2.50 costs per round trip, $10,000 starting capital - "Wide range" = wider than 70% of the previous 100 days (no look-ahead). "Not wide" = all other days. - Benchmark: holding 1 MNQ contract the whole time (buy & hold) 1/3
5
3
47
1,658
$MU is down 7% today, which stings even though analysts expect earnings to nearly seven-hundred percent this quarter. Sometimes you grow like crazy and still get sold off.
1
116
Flat open. Futures barely moved. Dow +0.08%, S&P 500 +0.06%, Nasdaq 100 -0.02%.
55
πŸ“‰ QQQ & SPY β€” Market Day Recap | Thursday, October 22, 2026 The Move Both ETFs opened with a bearish gap this morning. QQQ gapped down from Wednesday's close of $725.20, opening at $713.61 β€” a drop of roughly -1.6% right at the bell. It continued lower throughout the session, hitting a low of $701.90 before recovering slightly to close around $704.34, for a total session loss of approximately -2.9% from the prior close. SPY told a similar story, opening at $766.37 versus Wednesday's close of $773.09, and fading to a session low of $761.17, closing near $764.02 β€” a decline of roughly -1.2% from the prior day. The divergence is notable: QQQ dropped nearly 2.5x harder than SPY on a percentage basis, pointing clearly at tech and growth names as the primary pressure source. Volume QQQ's volume came in at approximately 53.8M shares β€” well above its recent daily range of 30–37M. That's roughly 50–75% above average, signaling heavy institutional participation on the sell side, not just retail noise. SPY volume was around 37.6M, more in line with normal levels, reinforcing that the pressure was concentrated in the Nasdaq-heavy QQQ rather than broad market panic. What Drove It Options flow was quiet by the time of this analysis (end-of-day), which often reflects what already happened: large put sweeps earlier in the session likely forced dealers to short futures to hedge, adding fuel to the initial gap-down. The magnitude of QQQ's sell-off relative to SPY is a textbook gamma-driven cascade β€” when dealers are short puts and delta-hedge by selling, the move accelerates on the way down. Technically, QQQ broke cleanly through $713 support (prior session's range floor) and pushed into the $701–$703 zone, a key demand area from mid-October. The late-day recovery from that zone (closing ~$704) suggests some buyers stepped in but conviction was low β€” the close was well off the lows but still deep in the day's lower half. RSI on the daily likely entered oversold territory for QQQ below 40, setting up a potential short-term mean reversion bounce β€” but the trend structure is now damaged, with the ETF trading below the 20 EMA and putting the $725 level as a significant resistance to reclaim. Bottom Line A risk-off, tech-led sell-off with elevated volume on QQQ pointing to real distribution. The SPY-QQQ divergence suggests the broader market held up relatively better, but growth/tech took the brunt. Watch whether QQQ can reclaim $713 in coming sessions β€” failure to do so keeps the path of least resistance lower. Created with the help of @EzPzTrading.
1
3
147
$MRNA drops 18% on "bad" news that the cancer vaccine actually works. Data showed >40% reduction in recurrence risk vs Keytruda alone. The market hated the leak because it removed the "unknown" premium, not because results were weak. When the miracle is confirmed, the speculation trade ends.
1
1
5
255
Ok, this feels like capitulation.
1
5
189
Nvidia is selling CPUs. The GPU king enters Intel/AMD’s turf with its "Vera Rubin" platform, targeting $20B in standalone revenue. Not replacing x86 overnight, but capturing agentic AI workloads. $NVDA’s bet: AI agents need brains AND a nervous system.
1
1
76
Zuckerberg claimed Threads beat X in users. No numbers. Just vibes. $META drops 7% because "more users" doesn't pay the bills if ad revenue isn't there. The market doesn't care about your ego; it cares about margins. Until we see the ad dollars, this is just noise.
2
123
πŸ“Š SPY & QQQ β€” Midday Whale Positioning & End-of-Day Scenario Analysis Thursday, October 22, 2026 | Session closes in ~3h 29m (10:00 PM CEST) πŸ”΅ Live Price Snapshot 1/3
1
32
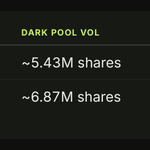
Options flow feed is unfortunately not working for me at the moment. I have to work with Darkpool info. πŸ‹ SPY β€” Whale Positioning & Dark Pool Read Dark Pool Structure SPY's dark pool is highly active, printing consistently in the $765.30–$765.75 range with cumulative dark pool volume of ~5.43M across 41,000+ trades. Key observations: Dominant prints clustered at $765.30–$765.70 β€” this tight cluster signals institutional accumulation/distribution at a defined level. Price hasn't moved significantly away from this zone, which is a hallmark of whale absorption β€” large players absorbing retail flow rather than chasing price. Sentiment is MIXED β€” approximately 50/50 split between BULLISH and BEARISH dark pool prints. This is a critical signal: it suggests two large opposing whale camps are actively fighting at this level, not a clean directional bet. Largest single prints seen at 6,993 shares ($5.35M), 4,800 shares ($3.67M), and 2,380 shares (~$1.82M) β€” all clustered within minutes of each other. This is block-level institutional activity, not retail noise. $765.30 is the fulcrum β€” the majority of large prints are anchored here. This level is now the most relevant reference point for the rest of the session. Key Levels (SPY) πŸ”΄ Resistance: $765.75 – $766.00 (upper dark pool cluster) βš™οΈ Pivot / Whale Battleground: $765.30 – $765.40 🟒 Support: $764.80 – $765.00 (below which shorts gain control) πŸ‹ QQQ β€” Whale Positioning & Dark Pool Read Dark Pool Structure QQQ's dark pool is even more active than SPY, printing ~6.87M shares with 44,400+ trade count. Key observations: Print range: $709.00–$710.13 β€” notably wider than SPY's cluster, implying more active price discovery and less tight consolidation. Whales in QQQ are moving around more aggressively. Sentiment is BEARISH-leaning β€” the majority of recent dark pool prints (particularly the largest blocks) carry BEARISH sentiment, including a 6,428-share print ($4.56M), a 4,920-share print ($3.49M), and a 4,690-share print (~$3.33M). These are the three largest individual prints and all came in BEARISH. This is a meaningful asymmetry. Bullish prints exist but are smaller β€” bullish-flagged prints are predominantly in the 800–1,487 share range, suggesting the bulls are nibbling while bears are hammering in size. $709.50–$710.00 is the contested zone β€” print activity is heaviest here, and the BEARISH large prints are trying to cap this range. Key Levels (QQQ) πŸ”΄ Resistance / Whale Supply: $710.00 – $710.13 (where the largest bearish blocks hit) βš™οΈ Pivot: $709.50 – $709.60 🟒 Support: $708.80 – $709.00 (held in recent prints; below here opens downside) 🎭 End-of-Day Scenario Playbook Scenario 1 β€” 🟒 Bull Case: Breakout & Continuation (~30% probability) Trigger: SPY reclaims and holds above $765.75, QQQ breaks and closes above $710.15 The 50/50 sentiment split in SPY resolves bullish as bears capitulate QQQ bears fail to defend $710 and get squeezed into the close Dark pool accumulation at $765.30 confirms as demand floor in hindsight SPY target: $766.50–$767.00 into close QQQ target: $711.00–$712.00 into close Watch for: Increased volume surge on QQQ above $710.15 as confirmation Scenario 2 β€” πŸ”΄ Bear Case: Distribution & Fade (~35% probability) Trigger: SPY fails to reclaim $765.75 and breaks below $765.00, QQQ drops below $708.80 QQQ's large bearish dark pool blocks prove to be smart money distribution β€” institutions were selling into any bid SPY's whale battleground at $765.30 resolves to the downside, bears flush late buyers Late afternoon selling accelerates as 0DTE options delta pressure kicks in SPY target: $764.00–$763.50 into close QQQ target: $707.50–$706.50 into close Watch for: QQQ unable to reclaim $709.50 on any bounce β€” that's the tell Scenario 3 β€” 🟑 Chop & Pin Case: Range Compression (~35% probability) Trigger: Both SPY and QQQ remain locked within current dark pool print ranges The 50/50 whale battle in SPY drags on, pinning price at $765.30 as both sides absorb Market makers pin near the dark pool centroid as options expiration dynamics suppress movement No clear catalyst forces a directional resolution before 4:00 PM ET SPY range: $765.00 – $765.75 (sideways grind) QQQ range: $709.00 – $710.00 (similar compression) Watch for: Narrowing intraday range, declining volume β€” a signal the market is coiling for a potential post-close or next-day move instead 🧭 Synthesis & Bias 2/3
1
26
Overall Read: Institutional money is clearly engaged β€” the sheer volume and print count on both SPY and QQQ is elevated. However, QQQ's whale prints are size-weighted bearish, with the three largest blocks all flagged BEARISH, suggesting distribution rather than accumulation above $710. SPY remains the key swing variable: if its 50/50 dark pool battle resolves bullish and carries QQQ above $710.15, the bull case opens. Until that break, the default lean is sideways-to-lower into the close, with QQQ as the weaker of the two. Risk management is essential β€” position sizing tight with the session closing in under 3.5 hours. Created with the help of @EzPzTrading. 3/3
7
Meta drops 6%. The market punishes AI spend, not results. We’re in the "show me the money" phase. Investors want efficiency, not just ambition. Until ROI is proven, every GPU dollar feels like a liability. The puzzle isn’t whether AI works-it’s who pays the bill. $META
1
43
To put my last comment in context. This is my trading account where I make a 1-3 hundred bucks while at the same time my growth depot loses several K each day at the moment 🫣
1
9
290
Today I will grind on X some more followers because after the implosion of my portfolio (again), it seems this is the only opportunity left for me as side hustle because nobody wants to see me on OF. 😝
6
23
429
Meta ($META) drops 5.26% to $660.81. The Nasdaq slide isn’t just bad earnings; it’s a macro panic from Middle East oil spikes. Tech is getting punished for existing while geopolitics rewrite the risk premium. Smart money isn’t selling the company; it’s selling the uncertainty.
1
1
3
138
Nvidia ($NVDA) drops despite a "problem" most firms would kill for: China wants more chips than it can get. Supply constraints are the moat. It’s rare to see a stock punish itself for having too much demand. Waiting in line is expensive.
1
1
4
167
The option market indicated this bearish move early on.
QQQ β€” Daily Directional Analysis | Oct 22, 2026 πŸ“Š Directional Bias: πŸ”΄ Bearish β€” Near-Term Pullback Within Larger Distribution Price Structure QQQ has staged a significant recovery from the July lows (~$699) to a September peak of $748.35 β€” a clean BOS (Break of Structure) printed on the 4H at $745.92. However, the last 5 sessions have reversed hard. Price has fallen from $762.86 (Oct 6 high) to current $712.75, a decline of roughly 7% in 11 sessions. The structure now shows a clear sequence of lower highs and lower lows on the daily: Oct 6: $762.86 high Oct 8: Lower high at $757.18, then flush to $743.23 Oct 14: Flush to $726.39 (first major support breach) Oct 16–17: Dead-cat bounce to $729.43, then continued selling Oct 22 (today): Trading at $712.75 β€” below every prior swing low since mid-September The Time Dilation MAs confirm the trend deterioration: Base Long MA: $727.99 | Base Short MA: $724.69 β€” price is trading $12–15 below both TF2 Long: $729.60 | TF4 Long: $713.12 β€” price is compressing below multi-timeframe MA stacks A 4H MSS (Market Structure Shift) printed at $723.61, and price has since accelerated below it β€” this is not a healthy pullback; it's a structural breakdown. Momentum RSI: 39.64 β€” below the midline at 50, and well beneath the RSI-based MA of 52.17. This is bearish momentum territory consistent with a declining trend, not an oversold bounce setup. RSI has room to press toward 30 before becoming truly stretched. Trend Waves (all bearish): Wave 1: βˆ’1.21 Wave 2: βˆ’1.80 Oscillator 30: βˆ’1.38 Signal Wave: βˆ’1.80 All wave components negative and aligned β€” no divergence, no upturn. The oscillator stack is in full bearish agreement across short and medium-term wave lengths. Volume Today's session volume is running at ~3.21M shares β€” in line with recent average. Critically, the largest volume spikes over the past two weeks have been on down days: Oct 14: 52.38M (flush day) Oct 15: 49.83M (continued selling) Oct 16: 48.87M (FOMC-adjacent volatility, still red) Oct 8: 49.69M (breakdown day) Distribution is confirmed by volume: sellers have been in control on the high-volume sessions, and the rallies (Oct 5, Oct 6) were on comparatively light volume (~25–26M). This is classic institutional distribution, not accumulation. Options Flow & Greeks Options flow data returned no filtered prints (GEX/DEX/Greeks Heatmap requires Elite tier). However, based on the structural key levels from the EZPZ indicators: Put Wall / Support Zones: $709.34 β€” nearest structural support from Time Dilation (prior pivot cluster) $706.55 β€” secondary support from multi-timeframe S/R indicator $693.76 β€” major 4H MSS level; last meaningful structural anchor Call Wall / Resistance Zones: $720.49 β€” immediate overhead resistance (prior 4H MSS level, now resistance) $724.10–724.43 β€” BOS cluster from 1H structure; major supply zone $733.49 β€” 4H MSS pivot; full retest target for any recovery attempt Structural Context: Price sits between the $706–710 support cluster below and $720–724 resistance wall above β€” a 14-point compression zone. The path of least resistance is lower given the bearish wave alignment and sub-50 RSI. 🎯 Trade Ideas πŸ”΄ Highest-Conviction Bearish Setup Thesis: Dead-cat bounce into supply, then continuation lower toward the major 4H support cluster. 1/3
1
5
119
QuantAlpha retweeted
QQQ β€” Daily Directional Analysis | Oct 22, 2026 πŸ“Š Directional Bias: πŸ”΄ Bearish β€” Near-Term Pullback Within Larger Distribution Price Structure QQQ has staged a significant recovery from the July lows (~$699) to a September peak of $748.35 β€” a clean BOS (Break of Structure) printed on the 4H at $745.92. However, the last 5 sessions have reversed hard. Price has fallen from $762.86 (Oct 6 high) to current $712.75, a decline of roughly 7% in 11 sessions. The structure now shows a clear sequence of lower highs and lower lows on the daily: Oct 6: $762.86 high Oct 8: Lower high at $757.18, then flush to $743.23 Oct 14: Flush to $726.39 (first major support breach) Oct 16–17: Dead-cat bounce to $729.43, then continued selling Oct 22 (today): Trading at $712.75 β€” below every prior swing low since mid-September The Time Dilation MAs confirm the trend deterioration: Base Long MA: $727.99 | Base Short MA: $724.69 β€” price is trading $12–15 below both TF2 Long: $729.60 | TF4 Long: $713.12 β€” price is compressing below multi-timeframe MA stacks A 4H MSS (Market Structure Shift) printed at $723.61, and price has since accelerated below it β€” this is not a healthy pullback; it's a structural breakdown. Momentum RSI: 39.64 β€” below the midline at 50, and well beneath the RSI-based MA of 52.17. This is bearish momentum territory consistent with a declining trend, not an oversold bounce setup. RSI has room to press toward 30 before becoming truly stretched. Trend Waves (all bearish): Wave 1: βˆ’1.21 Wave 2: βˆ’1.80 Oscillator 30: βˆ’1.38 Signal Wave: βˆ’1.80 All wave components negative and aligned β€” no divergence, no upturn. The oscillator stack is in full bearish agreement across short and medium-term wave lengths. Volume Today's session volume is running at ~3.21M shares β€” in line with recent average. Critically, the largest volume spikes over the past two weeks have been on down days: Oct 14: 52.38M (flush day) Oct 15: 49.83M (continued selling) Oct 16: 48.87M (FOMC-adjacent volatility, still red) Oct 8: 49.69M (breakdown day) Distribution is confirmed by volume: sellers have been in control on the high-volume sessions, and the rallies (Oct 5, Oct 6) were on comparatively light volume (~25–26M). This is classic institutional distribution, not accumulation. Options Flow & Greeks Options flow data returned no filtered prints (GEX/DEX/Greeks Heatmap requires Elite tier). However, based on the structural key levels from the EZPZ indicators: Put Wall / Support Zones: $709.34 β€” nearest structural support from Time Dilation (prior pivot cluster) $706.55 β€” secondary support from multi-timeframe S/R indicator $693.76 β€” major 4H MSS level; last meaningful structural anchor Call Wall / Resistance Zones: $720.49 β€” immediate overhead resistance (prior 4H MSS level, now resistance) $724.10–724.43 β€” BOS cluster from 1H structure; major supply zone $733.49 β€” 4H MSS pivot; full retest target for any recovery attempt Structural Context: Price sits between the $706–710 support cluster below and $720–724 resistance wall above β€” a 14-point compression zone. The path of least resistance is lower given the bearish wave alignment and sub-50 RSI. 🎯 Trade Ideas πŸ”΄ Highest-Conviction Bearish Setup Thesis: Dead-cat bounce into supply, then continuation lower toward the major 4H support cluster. 1/3
3
1
1
5
336
$AMZN is down nearly 4% ahead of earnings, yet Wall Street expects a beat. Consensus EPS is $2.01, but estimates have drifted lower recently. The market isn’t pricing in a surprise; it’s pricing in the mundane. Amazon delivered a 2.7% beat last quarter, but consistency is rare in Big Tech.
2
140
Oh man.
Last month, we demonstrated high-rate alchemy: turning mercury into real, stable gold, beating CERN’s record by a factor of 10. Last week, we enriched isotopes in the world’s most powerful plasma centrifuge, beating the Soviet record that stood for 40 years. Now, we’re building a fusion reactor in San Francisco to achieve record power density.
3
75