

Global head of equity strategy for @Bloomberg Intelligence👨🏻💻 | 2020 Dow Award Winner 🏆 | Lover of hip hop and ankle picks | #Bitcoin
New York, NY
Joined March 2011
- Tweets2.3K
- Following559
- Followers3.6K
- Likes3.4K








First day pops tell you nothing about forward returns. There is not relationship between day 1 returns and subsequent 12-month returns (excluding day 1)

1
8
Forward 1-year returns (including the first day pop) are much more mixed. About half outperform and half underperform. Big diff in mean vs median bc of large positive outliers

1
10
Day 1 pops are large and nearly universal. 24 or 25 IPOs outperformed the S&P 500 in their first day (sorry Uber)

1
8
Average excess return path. For every company, we calculate the stock's cumulative return from the IPO offer price and subtract the S&P 500's cumulative return over the same period, tracking the results daily through the first 12 months of trading.

1
23

Mega IPOs are good investments... if you get the deal price
25 largest US IPOs (by deal size):
• Buy at the deal price → beat the S&P 500
• Buy at the day-one close → underperform
• 24 of 25 beat the S&P 500 on day one
Forward excess returns if you get the deal price:


I've wondered the same thing. To add even more confusion, a lot of short term retail traders say "momentum" and it basically means what has gone up over the last couple days.
1
1
125
S&P 500 returns in the 3 months pre and post midterms since 1946...
**this is price only returns**
1.8% average before vs 7.5% after

202


Christopher Cain retweeted

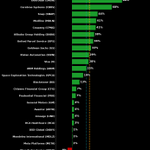
My Bloomberg Intelligence colleagues Jennie and Iza from our equity strategy team put out a note this morning on the stocks most and least correlated to AI. Here's a sample from the note with highest and least correlated quintile stocks:

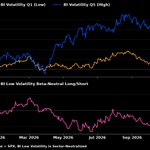
L/S momentum factor (S&P 500, sector-neutral) has retraced about half of its late summer situational awareness bloodbath.
Still up ~18% on the year tho

1
9
702
Average pairwise correlations near historic lows. Here we take the avg of trailing 30-day correlation readings using all possible combinations of stocks in the S&P 500 through time

1
160

Near-record idiosyncratic variance ... stock-specific forces are dominating market forces. This is calculated by regressing every point-in-time S&P 500 member's 26-weeks of returns on the S&P 500 and taking 1 − R² as the share of that stock's variance the index doesn't explain.

2
4
350
Some weird stuff going on under the hood of the S&P 500 right now
None of this is necessarily bearish IMO, but worth watching:
The index looks pretty calm. Underneath, stocks are increasingly doing their own thing.
Record % of stocks with negative 26-week market betas:

