

Data lover, storyteller, and pro question asker. Data Viz Engineer @USAFacts. She/her. Opinions are my own. Prev: @puddingviz on 🦣 [email protected]
- Tweets2.5K
- Following1.5K
- Followers3.5K
- Likes3.5K
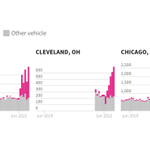
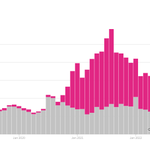
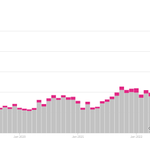











ALT A stacked bar chart showing the number of Kia or Hyundai thefts and "other" vehicle thefts in Chicago from Jan 2019 to December 2022. From Jan 2019 to around June 2022, total number of vehicle thefts increased slightly, and the number of stolen cars that were either a Kia or Hyundai remained small (around 5-8% of all thefts). Starting in July 2022, the total number of stolen cars increased quickly, and by September had doubled the average monthly count for the first half of the year. The number of "other" vehicles stolen remained relatively steady, while the number of Kia and Hyundais stolen increased dramatically, making up around 58% of all stolen cars by October 2022, and decreasing slightly to 55% in December 2022.

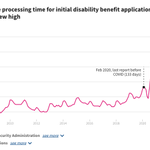
ALT A line chart with title "The average processing time for initial disability benefit applications has reached a new high." The line remains fairly steady between 100 and 120 days from 2008 to 2019. In Feb 2020, wait times were 133 days. They have increased fairly steadily since, peaking at 210 days in December 2022. The chart source is the Social Security Administration.