

We post an interesting figure from a Planetary Science paper every week. Managed by @henrymanelski, @smmenten98, @KrisLaferriere, @pcharon2000.
- Tweets94
- Following27
- Followers310
- Likes28
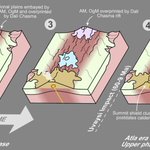






ALT This figure is a conceptual diagram, depicting the evolution of Atla Regio on Venus using four block models spanning from before the arrival of the mantle plume, to the present day. On an otherwise ordinary area of regional plains, plume-related volcanism begins initially with several volcanic centers along a zone of extension called Dali Chasma. Subsequently, activity shifts to Ozza Mons and declines elsewhere. Recently, following the Uvaysi crater impact which forms a stratigraphic marker, activity at Ozza Mons has waned and Maat Mons represents the current, and likely active, volcanic center today.


ALT This two paneled figure shows a visible image (a) and an infrared view (b) of active lava in the Zal region of Io. Red circles in (a) indicate the location of fresh lava breakouts and a red arrow in (b) shows an elongated emission feature interpreted as a lava fountain.


ALT his figure shows four displays of Ariel’s surface. The top left shows the reconstructed surface made by putting the red outlined surface (cratered plains) together. The yellow lines show a chasma which in the reconstruction is continuous. This is representative of the surface before the spreading centers separated the cratered plains. The top right shows the surface as it was imaged by Voyager 2, with the mapped boundaries of Kra chasma and the crater plains shown. The bottom row shows the same images as above, but with the boundary interpretations removed.


ALT This figure shows 3 panels. On the left, a clast of the sample includes sodium sulfate grains. The middle panel shows an ion map with halite (NaCl) and sylvite (KCl) identified in a particle. On the right, sodium fluoride grains are identified with phyllosilicates.


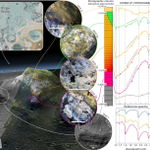
ALT This plot explores a mound in Mawrth Vallis, an ancient valley on Mars. In the top left is a map showing the location of the mound within the Chryse Planitia region. In the lower left is a 3D view of the mound, rendered using a digital terrain model. CRISM infrared spectra are shown on the right side to compare the mineralogy of various sections of the mound with different elevations and surface expressions. USGS reference spectra for nontronite, vermiculate, and saponite (three clay minerals) are displayed in the bottom right.


ALT This plot shows four views of Mars taken from orbit by Mars Express and Mars Reconnaissance Orbiter. Several cyclone dust storms at the edge of the north polar cap are highlighted, which appear as light and red-toned transient features with several morphologies (spiral, irregular, and arc-shaped).


ALT This diagram shows the north pole of Mars. There is a permanent ice cap as well as a seasonal cap shaded in. There are two Hadley Cells labeled on either side of the pole as well as an arrow indicating a polar vortex moving counterclockwise. Finally, a CO2 ice cloud is marked on the pole.


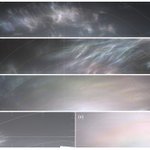
ALT This five paneled figure shows various iridescent (colorful) clouds in the sky imaged by the Curiosity rover on Mars.

ALT The image shows the sample age versus cumulative crater frequency, comparing the measured sample ages (colored points) to two modelled nearside lunar cratering chronology lines. The Chang’e-6 data point (shown in red) matches the predicted age from the modeled nearside cratering chronology well (the measurement error bars overlap both of the plotted model lines).


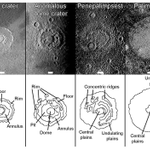
ALT This figure consists of 6 panels, showing the 6 types of large impact feature this study identifies. Each panel consists of a black and white image from the Galileo Spacecraft of a large impact feature on Ganymede or Callisto that is representative of its type, and a simple sketch below it highlighting their key morphological features. The scalebar shows that these features are on average ~100s of km across, although the smallest is just 40 km in diameter and the largest exceeding 1000 km across. Each type is named after a distinct feature – in size order, they are: pit crater, dome crater, anomalous dome crater, penepalimpsest, palimpsest, and multi-ring feature.