

Planalytics is the global leader in predictive demand analytics that enables consumer-centric companies to understand buying decisions and take action at scale.
Berwyn, PA
Joined April 2009
- Tweets2.5K
- Following1.4K
- Followers1.8K
- Likes209





Pinned Tweet
A huge shout-out to the @sharefoodphilly! Thank you and your team for your hospitality and for making the @PlanalyticsWx Community Service Day 2023 a great success yet again! 🥫 👏😁
#sharefoodprogram #sharefoodphilly #community #volunteer #philly #fighthunger #MakeADifference
Planalytics, Inc. retweeted

✨ Volunteer Spotlight ✨ Planalytics employees volunteered at our warehouse on 11/14, assembling and packing more than 500 boxes of food for seniors in our community! Join the fun & volunteer with us ⬇️
sharefoodprogram.org/get-inv…

11/4: Celebrating another humbling year volunteering at @sharefoodphilly for the @PlanalyticsWx Community Service Day #2023! The #sharefoodprogram's commitment to giving back is extraordinary and we thank you!!! bit.ly/3hAy3jI
#nonprofit #givingback #philly👏

ALT Planalytics employees @ Share Food Program, Philadelphia, PA
'Markdown Madness!' by #Planalytics featured in @RetailDive -- Markdowns are costly but are also an area of opportunity for #retailers. Learn how companies use #analytics to manage markdowns and drive profitability: bit.ly/3qGTTng

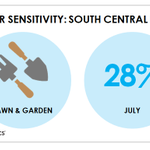
Did you know? In the month of July, 28% of Lawn & Garden product #sales in the South Central region are influenced by #weather. bit.ly/2uCPbxr #retail #analytics #demand #forecasting #DIY

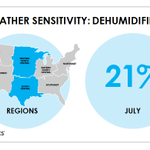
DID YOU KNOW? On average, approximately 21% of dehumidifier #sales are influenced by #weather in the Central region during the month of July. bit.ly/2uCPbxr #retail #analytics

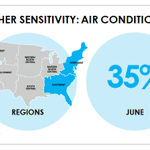
DID YOU KNOW? In the month of June, 35% of Air Conditioner sales are directly influenced by #weather in the eastern region. bit.ly/2uCPbxr #retail #demand #analytics

Did you know? On average, approximately 16% of Packaged Ice #sales are directly influenced by #weather during the month of June in the Gulf Coast region. bit.ly/2uCPbxr #retail #demand #analytics

Thank you @the_brc! Great article featuring #Planalytics in the #Spring 2020 edition of The Retailer, 'Profiting from #Weather by Using Demand #Analytics' here: bit.ly/35YgaBu #retail #demand #sales

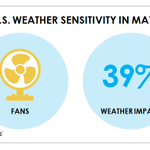
DYK?: In the month of May, 39% of Fan #sales are directly influenced by #weather in the U.S. on a national basis. Learn more: bit.ly/2uCPbxr #retail #demand #analytics

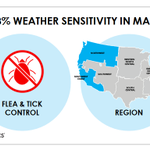
Did you know? On average, 8% of total Flea & Tick Control #sales in May in the Pacific Region are directly attributable to changes in the #weather. Learn more: bit.ly/2uCPbxr #retail #analytics

DYK? In the month of #April, 19% of BBQ/Grilling #sales in the Southwest are influenced by #weather while only 6% of BBQ/Grilling sales are influenced by the weather in the South Central region. Learn more: bit.ly/2VWGhnL #retail #analytics

DYK?: On a national basis, #weather directly influences 11% of #demand for Exterior Paint & 15% for Lawn Mowers in the U.S. during the month of #April. Learn more: bit.ly/2uCPbxr

DYK?: On average, #weather impacts #retail #demand for Capris by 16% in the Southwest region during the month of March. Learn more about @Planalytics' wx sensitivity #analytics: bit.ly/2uCPbxr

Did you know?: On average, 33% of Grass Seed #demand is influenced by #weather in the Central region during the month of March. bit.ly/2uCPbxr #retail #analytics

DID YOU KNOW?: On average, 9% of Soup #sales are directly influenced by #weather in the Midwest region during the month of February. bit.ly/2uCPbxr #retail #analytics

In #February, 29% of Thermal #sales in the Northeast are influenced by #weather while only 6% of Thermal sales are influenced by the weather in the Southwest Coast. bit.ly/2uCPbxr #retail #analytics

26% of Winterwear (hats, gloves and scarves) #sales in the eastern U.S. in #January are directly tied to the #weather. Learn more about Planalytics’ Weather Sensitivity #analytics: bit.ly/37pvw1Z #retail

