

Believer, learner, husband and father of two. Education Coach | @SchwabNetwork Contributor. Important Disclosures: https://xitter.cf/t.co/Rw5Uvfq2Y5
New England
Joined August 2026
- Tweets202
- Following70
- Followers278
- Likes110




Pinned Tweet
⚠️ My only official X account is @PatrickCiummoCS
I will never DM you first, sell anything, or ask for funds. Any account claiming to be me and doing so is an impersonator. Please report it.
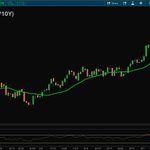
Don't fight the Fed? How about don't fight the VWAP. #US10Y now below VWAPs anchored to the recent high and last week's move below 5.23, with the 20-day looming just above near 5.19.
@SchwabNetwork @SchwabTrading
Charts are for illustrative purposes only and not a recommendation.


Wouldn't expect this #US10Y rounding out to go down without a fight back to previous areas of interest near 5.16 and 5.19.
@SchwabNetwork @SchwabTrading
Charts are for illustrative purposes only and not a recommendation.

Asked to break down $DDOG on Morning Movers @SchwabNetwork today. Rejections at 280 to 300, then an 11% drop last week. If this morning's Bernstein upgrade gap fades, the 50-day and May and August earnings VWAPs at 238 to 247 could serve as potential support. Earnings 11/4.
@SchwabTrading charts are for illustrative purposes only and not a recommendation.

Only one name met my criteria to carry over into the new week. $TBBB, a Mexican discount grocery chain and peer of $DG and $DLTR, closed Friday at a fresh high, three weeks after first showing up on the scan. Also an extremely low beta of 0.02. Earnings 11/18.
@SchwabNetwork @SchwabTrading
Charts are for illustrative purposes only and not a recommendation.

$TBBB finished last week near its all time high, up 215% from its February 2024 IPO price of $17. Is this young ticker worth monitoring going into the new week?
@SchwabTrading @SchwabNetwork
Charts are for illustrative purposes only and not a recommendation.

Worth another look as we head into the end of October.
Past performance is no guarantee of future results. Third-party content shared for educational purposes only. Not affiliated with or endorsed by Schwab.

Price fluctuating around the gold line heading into the weekend. Enjoy it.
@SchwabNetwork @SchwabTrading
$NQ $NQ_F charts are for illustrative purposes only and not a recommendation.

The VWAP anchored to the largest volume bar of the past year on E-mini Nasdaq futures sits at 29,719. That bar came back in June.
The index is 6.1% off its 10/6 high in 7 trading days, now challenging that line. This year's heaviest footprint.
@SchwabNetwork @SchwabTrading
$NQ $NQ_F charts are for illustrative purposes only and not a recommendation.

Discussed $GOOGL on The Watchlist @SchwabNetwork today. Closed just under its 200-day, another market leader under pressure, with that peculiar 252-day rising up underneath. Can it hold into October 28 earnings?
@SchwabTrading charts are for illustrative purposes only and not a recommendation.


Patrick Ciummo retweeted

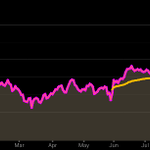
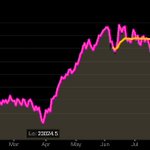
Another huge breadth day, with a massive 378 stocks in the S&P 500 higher today.
Most since June 12.
This is now 9 out of 11 days with more advancers than decliners.
This isn't bearish action imo

Wouldn't expect this #US10Y rounding out to go down without a fight back to previous areas of interest near 5.16 and 5.19.
@SchwabNetwork @SchwabTrading
Charts are for illustrative purposes only and not a recommendation.
Potential rounding read on the #US10Y could be wrong. This is where you watch valid versus invalid play out. A move back below the anchored VWAP and the 21-day could change the tone, but for now this appears to be fighting for higher ground.
@SchwabTrading charts are for illustrative purposes only and not a recommendation.

The VWAP anchored to the largest volume bar of the past year on E-mini Nasdaq futures sits at 29,719. That bar came back in June.
The index is 6.1% off its 10/6 high in 7 trading days, now challenging that line. This year's heaviest footprint.
@SchwabNetwork @SchwabTrading
$NQ $NQ_F charts are for illustrative purposes only and not a recommendation.
The 200-day isn't black magic or voodoo. It's a number people agreed on. Neither is 252.
There are 252 trading days in a year, so the 200-day sits 52 days short. Both lag, but it's often surprising where the longer business focused moving average shows up on a chart.
@SchwabNetwork @SchwabTrading
$RUT charts are for illustrative purposes only and not a recommendation.

Covered some resilient tickers in spite of pressure in the $RUT with @MikeFairbournCS today in our Trading Price Patterns class, plus why monitoring the 252-day moving average may be helpful: $NPK $FTDR $VMD $MH
Full replay in the reply below.
@SchwabTrading tickers mentioned are for illustrative purposes only and not a recommendation.
#TraderTalks #SchwabCoaching
Potential rounding read on the #US10Y could be wrong. This is where you watch valid versus invalid play out. A move back below the anchored VWAP and the 21-day could change the tone, but for now this appears to be fighting for higher ground.
@SchwabTrading charts are for illustrative purposes only and not a recommendation.
Drawing support close to the candle bodies on the #US10Y was a challenge with all these wicks on the way up.
When wicks stop holding and bodies close below, that's potential distribution.
Use a crayon or paint brush over a pencil. These are zones, not exact prices.
@SchwabNetwork @SchwabTrading
Charts are for illustrative purposes only and not a recommendation.
