

#OpenAccess journal for research on #Water, #Sanitation, #WaterResources, and #Sustainability of water for people and planet
- Tweets445
- Following539
- Followers770
- Likes136

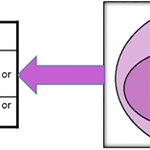






ALT Fig 1. Conceptual framework.

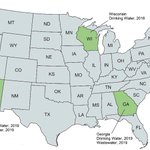
ALT Fig 1. Four states included in this study and data available.

ALT Photo of a flowing river with ricks, surrounded by forests.

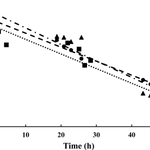
ALT Fig 2. Reduction of soluble chemical oxygen demand in synthetic wastewater in batch reactors seeded with soil microbes collected from a wastewater vegetated infiltration gallery. All samples were filtered through 0.2 μm cellulose acetate filters. Dotted line–Reactor 1; Dashed line–Reactor 2; Combined dot-dash line–Reactor 3.

ALT Fig 2. Photograph of an automated water kiosk located in a ger area in the northeast of the city of Ulaanbaatar.

ALT Impressionist painting of waves crashing on a green cliff side.

ALT Fig 1. Four states included in this study and data available.

ALT Fig 1. Conceptual framework.

ALT Photo of a flowing river with ricks, surrounded by forests.

ALT Fig 2. Photograph of an automated water kiosk located in a ger area in the northeast of the city of Ulaanbaatar.

ALT Impressionist painting of waves crashing on a green cliff side.

ALT Fig 1. Watershed applied toxicity. The heat map and legend values represent applied toxicity as the Net Toxicity Index (NTI), the total applied toxicity of pesticide applications to all aquatic taxa investigated over the simulation period, fish, invertebrates, nonvascular aquatic plants, and vascular aquatic plants. Results are displayed for each study extent, a) California’s HUC8 watersheds and b) the HUC12 subwatersheds in the Bay-Delta Watershed. The NTI ranges identify the magnitude of toxicity released during pesticide applications, with values in the upper range, greater than 50,000,000, illustrating areas of applied toxicity that are up to 8 orders of magnitude greater than other watersheds. Base map source:http://goto.arcgisonline.com/maps/Reference/World_Imagery.

ALT An abstract image of leaves and water and trees, color-washed in hues of green, blue, and white.

ALT Fig 6. Proportional potential functions subset by depth of pit latrine sample and pooled for both sites and averaged over the 55 sampled pit latrines. Percentages greater than 3% are displayed for the surface, mid-point, and maximum depth layers.

ALT An arial photo of a river in the middle of city with some green space, two bridges connect the opposite sides of the city separated by the river.