

#OpenAccess, multidisciplinary journal on optimizing the use of renewable resources, transforming the global economy & achieving a sustainable future
- Tweets289
- Following36
- Followers457
- Likes43





ALT Fig 6. General schematic of platform structures (adapted by E. Carr after Scarborough Bull and Love, 2019). Anchored platforms vary in depth from shallow water (left) to 1,500 ft to the SPAR Platforms at 10,000 ft. The complexity of the structure also varies providing different levels of habitat provision.


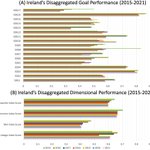
ALT Fig 5. Ireland’s SDG performance from 2015–2021. (A) Illustrates the country’s annual performance disaggregated by SDG goal. (B) Depicts annual performance disaggregated by SDG dimension.

ALT Fig 2. Author’s Map of RUNRES city regions. Produced under Humanitarian data exchange “numérisation Saint Moulin” source, in Arcgis Desktop software taken from the shape file https://data.humdata.org/m/dataset/cod-ab-cod.
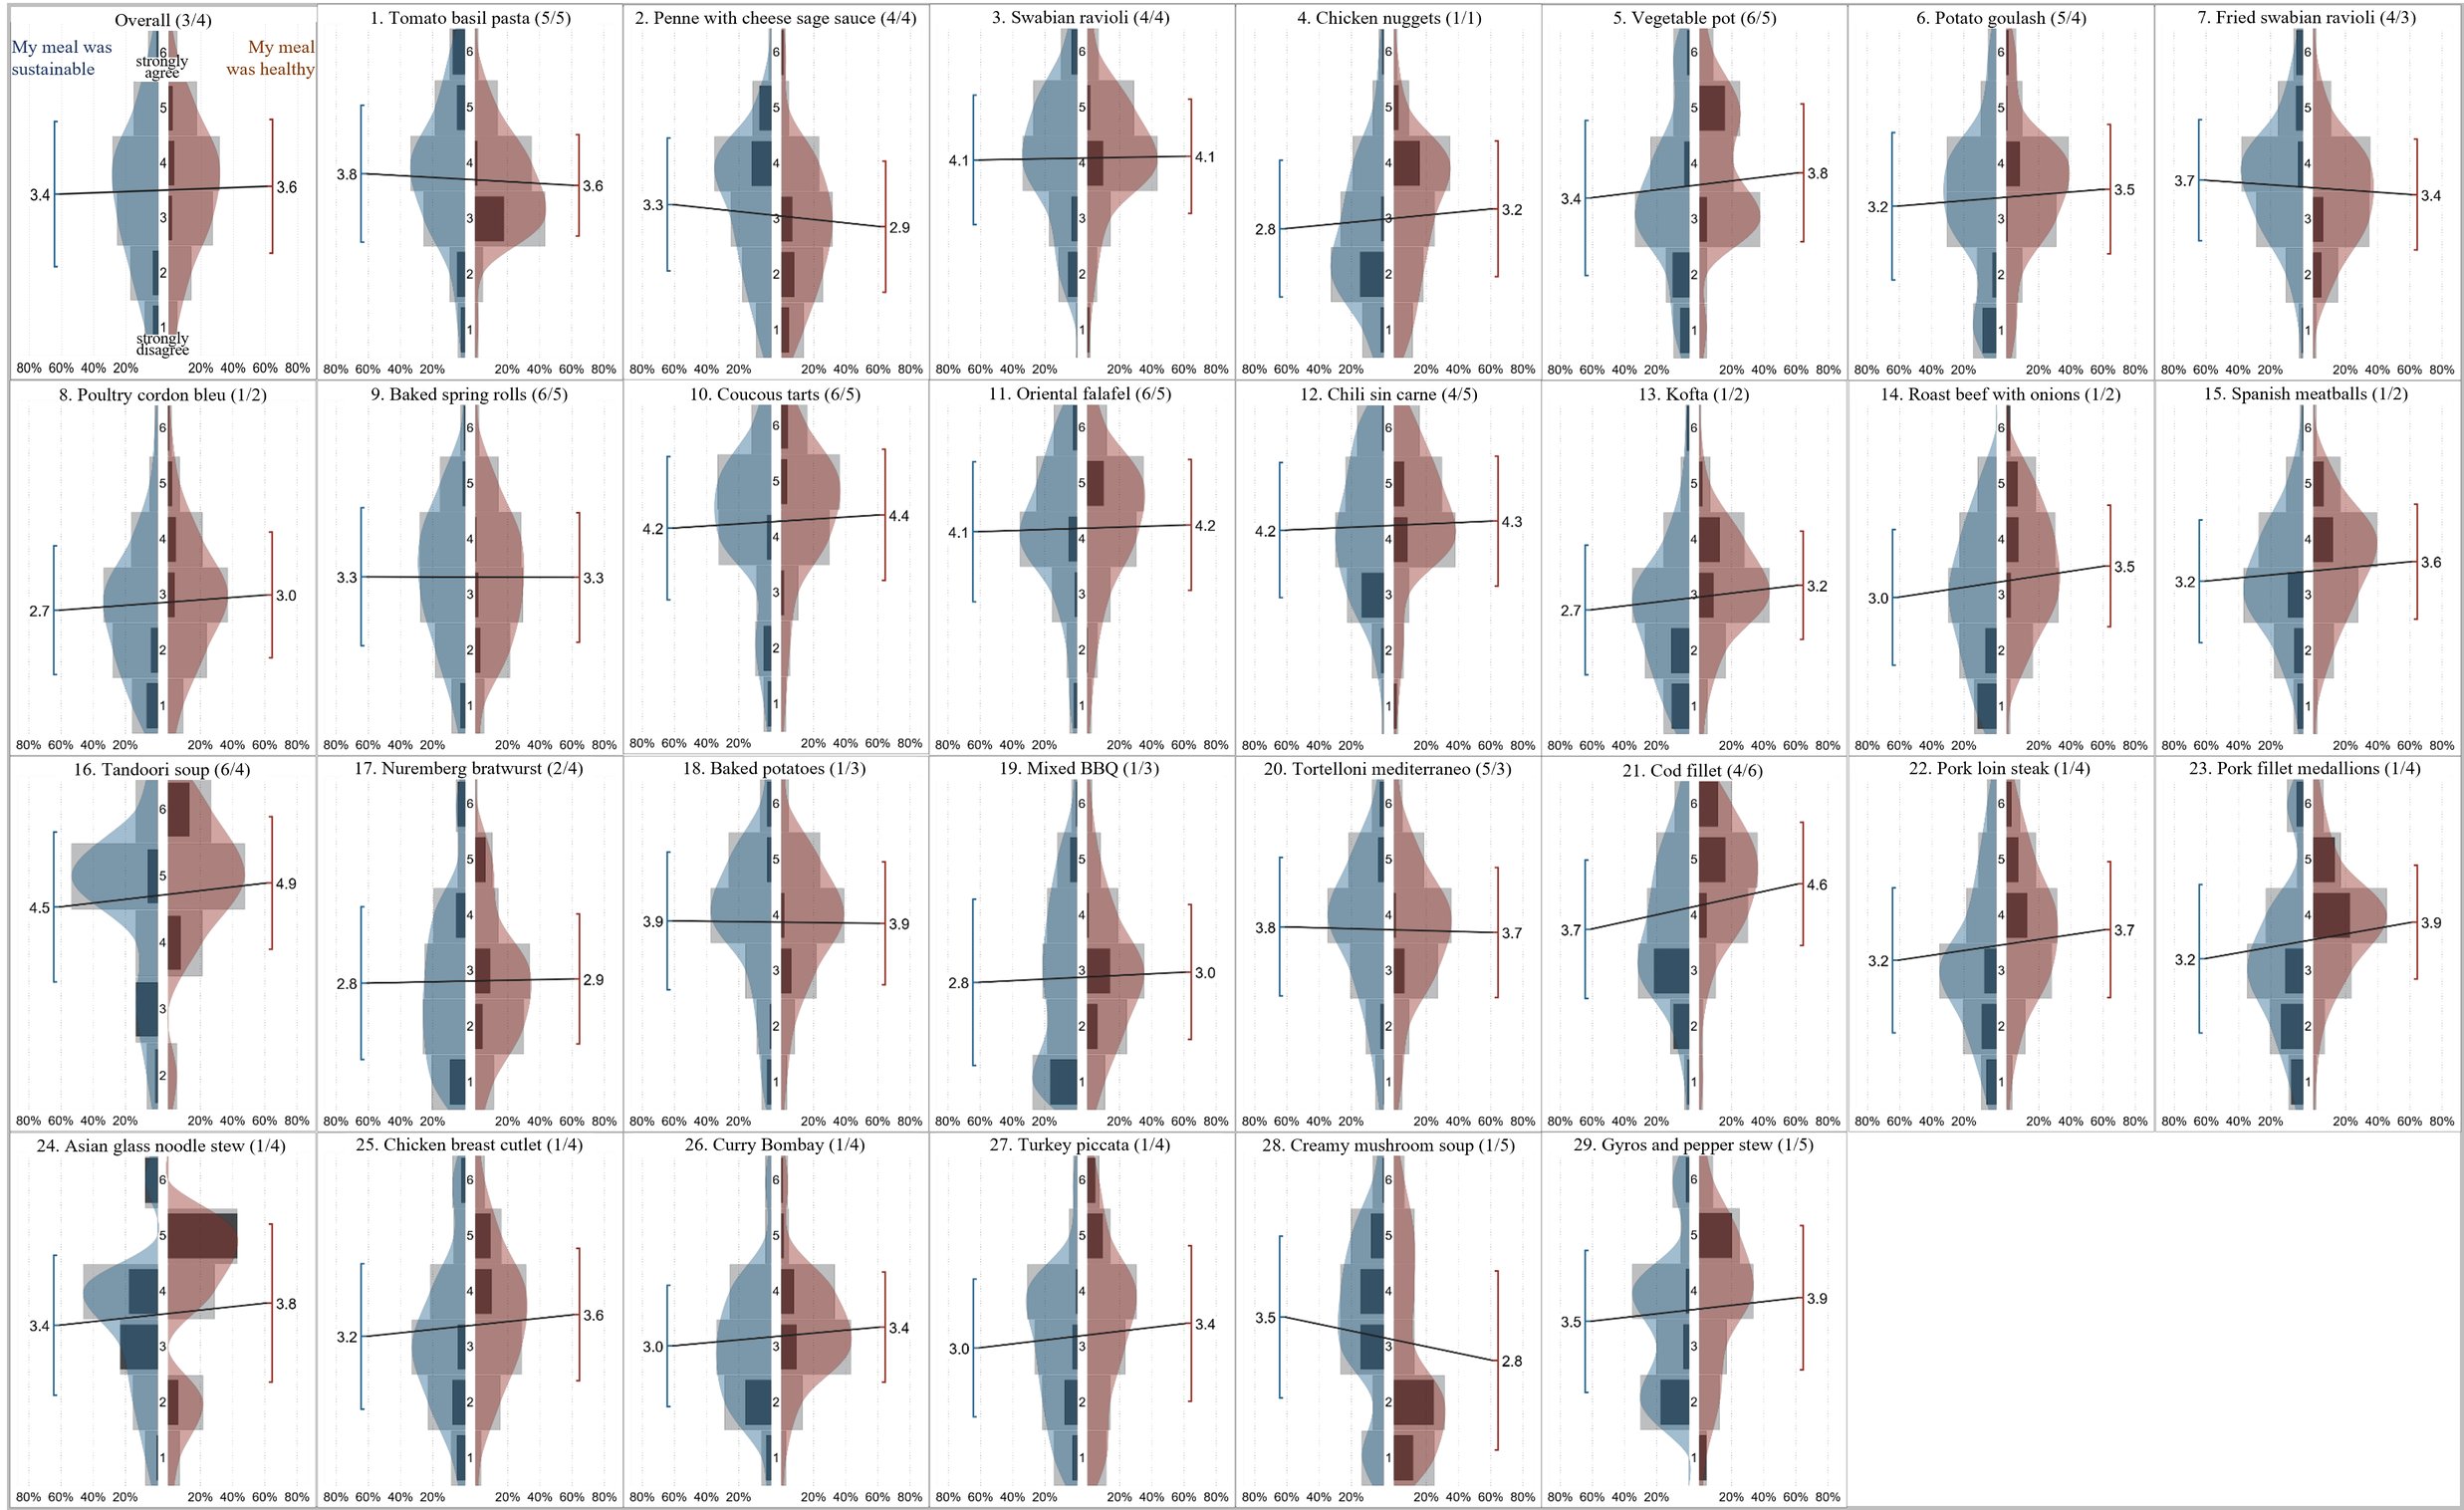
ALT Fig 1. V-plots for perceived sustainability (blue) and healthiness (red) of the 29 meals. Smoothed density distributions (red/blue shape) show the type of distribution; histograms (light gray) depict the relative frequency of each response category; difference histograms (dark gray) highlight the differences in each response category; means and standard deviations are depicted as lines in red/blue above the distributions. Mean values are connected via a black line for comparison. Numbers in parentheses after the meal name refer to their actual environmental sustainability and healthiness scores.