

Evidence-based financial education and fun stats. Part research, part ramblings. Tweets ≠ advice. YouTube vids at https://xitter.cf/t.co/ITcRYaJeJ8
USA
Joined September 2020
- Tweets10.2K
- Following71
- Followers3.2K
- Likes9.3K




Pinned Tweet
OVL is basically 110% SPY with a 0.79% fee and a 10% yield.
I'm not a fan of discretionary trading, and I'd prob take 95/5 VOO/UPRO over it, but it will be interesting to see if it outperforms long term and can sustain that yield.
Review here: optimizedportfolio.com/ovl/

This is why income ETFs have billions in AUM. This is how the average shareholder thinks about them.


Optimized Portfolio | John Williamson, APMA® retweeted

"Dividend nomads" aka people who don't understand how dividends work.
About 40% of pros and 75% of individuals think dividends and passive income are a magical bonus.
xitter.cf/MebFaber/status/204122…
bloomberg.com/news/articles/…

We did a survey on how dividends work and received thousands of responses...
Q: "Which of the following best describes how dividends work for a stock investor?"
A1: "A stock yields 5%. The stock is trading at $100 and pays a $5 cash dividend. After distribution, the investor now has a stock worth $95 and a $5 cash dividend."
A2: "A stock yields 5%. The stock is trading at $100 and pays a $5 cash dividend. After distribution, the investor now has a stock worth $100 and a $5 cash dividend."
The good news? Meb's audience (mostly) gets its.
90% of pros understand how dividends work, and 80% of individuals. 👏
HOWEVER, for the broad-based audience, the results are DISMAL.
60% of pros understand how dividends work (despite 90% rating their knowledge at "average to very good")...
Only 25% of individuals understand how dividends work.
You read that right, 75% of individuals think that dividends are free money paid out like an allowance or bonus...
This agrees with my experience over the last 20 years.
Most individuals, and a non-trivial number of professionals, do not understand the most basic input in all of investing!
This explains everything from the irrational preference for dividends to predatory offerings focused on paying out magically high dividends to hope and dreams of passive income.
We will publish a longer paper on this soon, but in the meantime, stay tuned for a great podcast on the topic dropping shortly!
Optimized Portfolio | John Williamson, APMA® retweeted

Income Twitter had a big weekend. So let’s do something useful with it: take one real, public income portfolio and run the numbers. He’s shared all of them.
Not a dunk. I want everyone here to be rich and happy, and plenty of people get rich the “wrong” way. Good for them. But, a lot of people are copying this setup without seeing where the cliff is.
THE NUMBERS (all his)
Spends $10–12k a month
Holds about 10% of net worth in cash
Says that cash covers 24+ months of spending
Generates $35–40k a month in “income” and pays $10–12k a month in tax
If 10% equals about 24 months of spending, the portfolio is roughly $2.4–2.8M. We'll just call it $3M.
Spending $120–144k on $3M is a 4–4.8% withdrawal rate. For a 50-year retirement, research generally lands around 3.25–3.75%.
If he's closer to $2.5m, that's 4.8-5.76%.
Just because someone doesn't believe in safe withdrawal rates doesn't mean the withdrawal rate doesn't exist. He has one, and it’s a little high.
I'll address this later, but safe withdrawal rates give you a way to avoid running out of money. If markets cooperate, in hindsight, you could have spent more. But, we don't get that crystal ball before we start spending from a portfolio.
WHERE $35–40K A MONTH COMES FROM
His high yield ETFs (SPYI, QQQI, GPIX, GPIQ, SCHD and others) yield about 9% blended. On ~$1.15M, that’s roughly $103k a year.
He has other funds/stocks that in total yield somewhere around 1% along with his cash which we'll say is around 3-3.5%. Somewhere around $30k/year total across those two "sleeves."
The other $300k+ is premium from options he sells himself: puts, then calls when assigned. He recently reposted the classic “sell 35 days out, 0.20 delta, kick back with a beer.”
That premium balances the books. It’s also the part that worries me. He hasn’t spelled out the strategy, so I’m assuming it’s the wheel, the most popular version on X. The math works the same either way.
1. Premium isn’t extra return
It’s payment for taking on crash risk. Selling calls gives away the big up years. Selling puts means buying the big down years. Day-to-day volatility looks lower, but the risk that matters doesn’t shrink.
It’s also stacked. The covered-call funds are already short volatility on the S&P and Nasdaq, and selling puts on top makes the same bet twice. His growth, “income,” and options sleeves all run on one engine: US large cap.
2. Markets have fat tails
In a calm market this looks like a paycheck. In a 2000 or a 2008:
Puts get assigned far above where the market is
To keep income coming, you sell calls below your cost
The rebound gets called away
A 24-month cash cushion is good. But the 2000–02 decline took about two and a half years to bottom, so the cushion runs out before the market does.
Picking up pennies in front of a steamroller works until the steamroller shows up.
3. The tax round trip
In fairness, SPYI and QQQI are genuinely tax-efficient. Nearly all of their payouts are return of capital, which is deferred, not eliminated.
That tells you where a $120–144k tax bill comes from: his own options trades, taxed as short-term gains at ordinary rates.
So he generates about $300k of taxable income he doesn’t spend, pays tax on it, and reinvests what’s left. Selling shares to cover spending would mostly be taxed at long-term rates, and only on the gain. That’s a fraction of the bill.
Every dollar sent to the IRS early is a dollar that stops compounding.
Funding spending from long-term gains instead could keep much of his federal tax at or near 0%, and a lower AGI could cut his health insurance costs meaningfully.
4. “I never sell shares”
His funds do it for him. Covered-call distributions are funded by premium, asset sales, and return of capital, which is your own money coming back. A distribution is a sale you didn’t click.
5. He didn’t retire. He changed jobs.
Watching deltas, rolling puts, and managing assignments every Friday, possibly for 50 years. That’s an unpaid portfolio-management job with no benchmark. And if he gets sick or loses interest, can his family run it?
THE IRONY: HE’S ALMOST THERE
At 3.5%, $3M supports about $105k a year. He spends $120–144k.
Two or three more working years and he’d be at a rate that survives almost anything. Or, starting today, a guardrail spending rule (spend a bit less after bad years) supports starting rates in the mid-4% range. Add a few years of light part-time income and the gap closes.
If his numbers are closer to $2.5m, then he's probably a bit further away...
The wheel isn’t what makes this retirement work... It’s actually making it fragile.
WHAT I’D DO INSTEAD
- A broadly diversified total-return portfolio
- 5–7 years of spending in bonds and T-bills, so a bad stretch never forces stock sales at the bottom
- A guardrail spending rule
- Sell shares tax-efficiently to fund life
Boring, cheaper in tax, and no Fridays required.
TO BE FAIR
Nobody knows the future. Rigid 4% rules lead lots of people to underspend and die with money they could have enjoyed. His strategy could work even if his process is wrong.
But the failure modes aren’t equal. Underspending is fixable. A blown-up early retirement at 45 with a ten-year résumé gap is not.
THE GOOD NEWS
You don’t need to pay anyone 1% to run this math. Give any decent LLM your real numbers (spending, portfolio size, taxes) and ask for your actual withdrawal rate and what happens in a 2000-style market. Ask the hard question, not “is my strategy good?”
Saw some great takes this weekend from advisors and sharp DIYers alike. The more people stress-test these setups before copying them, the more people end up rich and happy.
Not individual advice, but structural analysis and using one person as an example because someone rarely gives enough information to piece it all together.
@OptimizedPort @egr_investor @TKopelman @Eric_M_Courage

Someone is sharing my posts or something somewhere because I've gotten a lot of new followers the past few days but I can't see where they're coming from, maybe because I dropped the blue check so no more analytics. In any case, thank you, kind strangers! 😎
Suppose a hypothetical portfolio is 50% stocks and 50% bonds.
Now suppose stocks rise by 10% and bonds fall by 10%.
The portfolio is now 55% stocks and 45% bonds, written as 55/45.
Bringing it back to 50/50 - by selling some stocks and buying some bonds - is called rebalancing, and it probably only needs to be once a year or every few years.
Not rebalancing means your portfolio's risk profile no longer aligns with your target allocation, for better or worse.
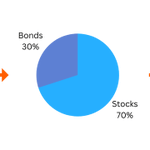
For a concrete example illustrated in the image below, a classic 60/40 portfolio in 2003 would have drifted to a more aggressive 70/30 going into the Global Financial Crisis of 2008 without being rebalanced, meaning a much rougher ride and a deeper drawdown. If left to run unchecked, that same portfolio would be near 85/15 today.
I explained rebalancing in more detail and included a calculator to help you do it here: optimizedportfolio.com/rebal…

How do accounts like this get 100k+ followers? Concerning.

i know very much how they work and im about to be a certified financial counselor @TKopelman
total return is not all that matters especially if people want to live off their investments.
how that return is created actually matters most and what stage people are in.
Reminder: If you plan to use just the dividend yield of your plain S&P index fund as income, then you're going to significantly delay retirement and then die with a lot of money left over. Both sound pretty terrible to me. As usual, I'll stick with total return.

You can always rely on @TKopelman to bring poise and rationality to the dividend conversation:

The “dividend-focused” mindset just doesn’t make sense to me.
Here’s why:
• Paying out a dividend lowers the value of the business by the same amount
• It is a forced sale and leads to taxes for you, even if you do not want the funds
Let’s break it down more:
Imagine your business has $1 million in cash.
You have two choices:
Reinvest it to grow the business
Pay it out to the owners as a dividend
If you pay it out, the business now has less cash, so its valuation drops.
You’ve just traded long-term growth potential for a short-term payout.
This is why focusing solely on dividend yield can be misleading
Maximizing long-term value often comes from reinvesting in growth, not taking money out prematurely.
Your investment mindset should consider total return, not just the immediate cash you receive
So in all seriousness for posterity since some seem to have missed the broader point last time,
1. 12% withdrawal rate is likely unsustainable.
2. The S&P can generate more than 1.3% in income. Comparing just the yields of 2 very different investments is silly. Total return is a thing.
3. The 4% Not-a-Rule™ does not say wait until you're old.
4. If by "tax efficiently" you mean 100% ROC, that advantage is likely 0.25% annualized at best, which is less than the fee of any income ETF I've seen: optimizedportfolio.com/roc-c…
This is how you play tennis without the net.


The math nobody does:
• $500,000 in income ETFs at a 12% distribution rate = $60,000/year
• That's $5,000/month hitting the account
• Same $500,000 in the S&P at a 1.3% yield = $6,500/year
• That's $541/month
Same half million. One pays your mortgage. The other pays your streaming subscriptions.
The 4% rule says wait until you're old.
Distributions say get paid now.
Tax efficiently before you say just hold $VOO
Outside my usual lane, but if you're into air quality, give @ThisHouseFresh a follow.
No affiliation, but the guy spends his own money to provide great unbiased reviews of air purifiers with practically useful data, production value is top notch, and he's another small business whose website traffic has been decimated by Google's AI.

This is happening to websites in every corner of the internet.
Google AI Overviews may be convenient for the searcher, but this convenience comes at a cost.
Sites like HouseFresh and Inspired Taste are powered by real people who spend real money and real time to create valuable content for the web.
We won't be able to survive if every Tech Giant keeps training their AI with our work without compensation just to sell convenience to their users.
If this continues, the information your AI of choice will offer you in a few years time is bound to be a mix of advertising, spam and old content from the days when websites were still alive.
Theory: Seems recently if you use a "cashtag" like $VTI and also a link in the same tweet, they somehow interfere with each other and the link doesn't show sometimes, but not every time. This only started about a month ago. Just my observation and something to watch out for.
Fun fact for the math nerds: My website visits follow almost a perfect textbook 80/20 Pareto distribution, which basically says 80% of the output comes from 20% of the input.
So in this context, 80% of the visits come from 20% of the articles.


Don't believe stuff like this. Take 30 seconds to run the numbers for yourself:

The math nobody does:
• $500,000 in income ETFs at a 12% distribution rate = $60,000/year
• That's $5,000/month hitting the account
• Same $500,000 in the S&P at a 1.3% yield = $6,500/year
• That's $541/month
Same half million. One pays your mortgage. The other pays your streaming subscriptions.
The 4% rule says wait until you're old.
Distributions say get paid now.
Tax efficiently before you say just hold $VOO
Hey @BuyIncomeETF, I obviously can't reply to you there so here's my reply:
I'm honestly not interested in engaging with a petulant, delusional, megalomaniacal grifter who flat out lies and argues in bad faith and who ostensibly can't even write legible English.
I have to assume he's purposely lying and mischaracterizing, because no one is that stupid (and because he's continued making the same dumb claims after others fact-checked him). I want nothing to do with that insecure manchild.
He's also literally sponsored by NEOS, so that inherent bias would make it unproductive anyway, I suspect.
Arguably more importantly, I'm a little freaked out at this point; guy is clearly obsessed with me and seems unhinged. I might go buy a Ring camera. I'm not sure what suddenly set him on this temper tantrum a couple days ago.
Thanks for the idea and the tag though. I might be up for a chat if it's with people who don't act like this:


"Annualized return" is not the same as "average annual return."
Annualized return is also known as Compound Annual Growth Rate (CAGR). It's the geometric mean that accounts for compounding over a whole period.
Average annual return is just the arithmetic mean value of a set of annual returns.
Here's an example to illustrate the difference.
Suppose an investment of $5,000 grows by 100% in the first year to $10,000 and then drops by 50% the next year back down to $5,000.
Over the 2 years, your CAGR was zero; you have neither gained nor lost money.
But your average annual return was 25%.
Obviously this is very misleading.
This is why we always quote CAGR, not average return.
optimizedportfolio.com/calcu…

Definitely not. I'm the first to admit I'm just a rambling idiot who mostly regurgitates ideas from people much smarter than me. There are also many people smarter than me who have different opinions.
I do, however, tire greatly of seeing grifters being misleading and selling newsletters to - and getting paid to push complex, high-fee products on - unsuspecting novices, so I do what tiny bit I can to try to push back on that kinda thing when it comes across my feed.
On the flip side, if someone posts good, useful, evidence-based, well-reasoned, well-researched content, I'm the first to be their cheerleader.
Sadly, the former seems to dominate FinTwit, or at least my algo.
Let me know if you're ever in the area and we can grab a beer and talk shop! :)

More fantasy:
The year is 2036.
Two retirees. Both started with $1,000,000 in 2026.
Retiree A followed the 4% rule. Sold shares every year to live. Ten years later: $412,000 left. The principal is half-eaten and still shrinking.
Retiree B put it in income funds at ~14%. Collected ~$140,000 a year in distributions. Ten years later: the full $1,000,000 still sitting there. For the heirs.
Same starting line. Same decade. Same market.
One ate the goose. The other collected the eggs.
It can happen via sequence risk before you roast this post.
Is the tax deferral of ROC from your income fund actually worth it? I made a calculator to find out. I think y'all will like this.
Spoiler: The deferral benefit basically equals the typically-higher fee so they cancel out. Explanation below. Link here: optimizedportfolio.com/roc-c…
Income funds that specifically aim for ROC (return of capital) have grown in popularity. ROCQ and GPIQ are recent notable examples. Proponents proclaim ROC is a significant tax benefit for current income over liquidating shares of low cost index funds, but I maintain the benefit is grossly overstated and misrepresented. ROC is often spoken about pretty vaguely without any concrete numbers to back up the claim.
Novice investors sometimes seem to treat ROC as tax-free income, but that's not really true. ROC is just kicking the tax bill down the road. It's deferral, not elimination. So the natural question is whether delaying the tax bill is worth more over time than the higher expense ratio these funds typically charge. This calculator tests exactly that for any given set of inputs.
Here's how it works. It compares an income fund that pays mostly ROC against a plain low-cost index portfolio, where you make your own “dividends” by selling shares. Both investors get the same pre-tax cash every year and the same gross total return, and the default ROC percentage is set at 97% (some very generous assumptions in my opinion), so the only differences are taxes and fees for a clean comparison. This is basically an unrealistic best case scenario for an income fund, which will typically lag its underlying over longer periods. I've set the index portfolio's blended expense ratio at a fixed 0.05%. You set the income fund's fee, payout rate, and ROC share, plus your personal tax rates.
The output will show:
- After-tax annualized return for each side.
- Net tax effect: how much the deferral helps (or hurts) per year.
- Effect of the higher fee: what the extra expense ratio costs per year.
- Net advantage: the result of the previous two combined.
- A chart and table showing when each side pays its taxes, including the year the income fund's basis hits zero.
In most of the scenarios I ran, the deferral roughly pays for the higher fee and that's it. They basically cancel out. The tax deferral is, at best, 0.25% annualized. As usual, no free lunch. Play around with it yourself. Try dropping the ROC share to 90%, for example, or bumping your capital gains rate, and watch the result move. Click Save Image if you want to share your results.
As always, this is a hypothetical illustration and is not financial advice or tax advice and is not an endorsement of any particular product or strategy.
Let me know your thoughts and if you think there's anything I should change or add. I'm sure I've forgotten something.
@cliffcornell_ and @RyanWhite1975 , I think you'll like this.
