

Canada
Joined September 2009
- Tweets10.8K
- Following1.8K
- Followers513
- Likes16.9K





Pinned Tweet
$ASTS 3D
1) Last Aug 2024-May 2025 was a 9 month ranged box - Built a base before a huge 600% (7x) more or less move to the Jan 29, 2026.
2) Then we went down and tested $63 and bounced back up to $133 and rejected this pulling back to date to $72.58 presumably by the effects of SPCX and the Shorts
3) If we follow a similar pattern (Anchor Aug 14, 2024 Analog) it won't be until Oct 2026 (9 months from Jan 2026) before we break out to the upside for a re-rate rally towards $185-$235, and ladder up like in 2025-2026 towardsa $400-$500
Bigger the Base, Higher in Space

$ASTS
🛰️ ASTS Full Elliott Wave Roadmap (Primary Degree)
📈 WAVE I (Complete)
$2.01 (2024 low) → $133.86 (Jan 30, 2026)
Clean 5-wave impulse. Pre-2024 SPAC bleed excluded — no real trend before BlueWalker 3 de-risked the tech.
🔄 WAVE II (In Progress) — Bullish Expanded Flat
A: $129.88 → $63
B: $63 → $133.9 (exceeded the Wave I high!)
C: unfolding now via nested 5-wave impulse down
Why B exceeding the prior high = BULLISH:
Expanded flats are the most common flat variant precisely because they signal underlying strength. Buyers pushed B above the old high because bulls never lost control mid-correction. This is a classic early/strong-correction signature inside a bigger uptrend, not distribution or a topping pattern.
🎯 Wave C Target Zone (Trend-Based Fib Extension):
0.618 = $63 (already broken)
1.236 = $52 (testing now)
1.382 = $50 (primary target)
1.618 = $42 (max downside boundary)
The box is $42-50. Don't model deeper than that.
⚠️ Could C wick below $49.3 (Nov 2025 Wave ④ low)?
Roughly 45-55% chance of at least a brief wick below $49.3 — but that alone doesn't break the thesis:
~40-45% chance C completes at $50-52 without ever touching $49.3 → shallow completion, quick reversal
~25-30% chance C wicks through $49.3 briefly then reclaims → still inside the $42-50 box, not a red flag
~20-25% chance C sustains below $49.3 toward $42 → approaching the outer boundary, still valid
~10-15% chance C breaks decisively below $42 → structure invalidation, deeper correction likely
Why this makes sense: expanded flat C legs commonly stretch to 123.6%-161.8% of Wave A, and corrections into a new degree often pierce prior lower-degree pivot lows before finding real support — that's normal "speed bump" behavior, not failure. A strong B wave (like ours, which took out the Wave I high) also tends to produce a more contained C, reinforcing $42-50 as the higher-probability zone rather than something deeper. Only a sustained close well below $42 would actually invalidate the pattern.
🚀 WAVE III Projection
Measured from the Wave II low using Wave I's ~$132 range:
1.0x extension ≈ $180-195
1.618x extension ≈ $265-280
2.618x extension ≈ $400-410 (if fully extended)
3rd waves are historically the strongest/longest leg. Rule of thumb: only ONE of Waves 1, 3, or 5 tends to extend.
🔄 WAVE IV Projection
Standard 38.2-61.8% retrace of Wave III. Must stay above $133.86 (can't overlap Wave I). If III = ~$400, IV likely retraces to ~$230-270.
🎯 WAVE V — The Real Target
Since Wave III likely extends less aggressively if Wave V is the "special" leg, and given ASTS's profile — hypergrowth direct-to-device telecom, $30B-200B TAM, FCF inflection expected 2027-2028, major MNO deals (Vodafone, AT&T, Verizon) — this isn't a commodity mania play. It's a genuine operating-leverage compounding story.
That fundamentally supports Wave III staying more modest (~$180-200) while Wave V becomes the extended, fundamentals-driven blow-off leg:
Wave V target: $400-900+
This aligns well with analyst 2030 price targets already clustering in the $240-500+ range on fundamentals alone.
✅ BOTTOM LINE
Right now: watching $42-50 for Wave C / Primary Wave II completion. A brief wick below $49.3 is plausible and wouldn't break the setup.
Confirmation: reclaim of $63-66 (Wave A low) = flat is done, Wave III ignition begins.
Then: Wave III runs → pulls back (Wave IV) → Wave V blow-off into 2028-2030 as FCF inflects positive.
This isn't a top — it's a textbook bullish expanded flat reload before AST's most explosive fundamental + technical leg yet. 🛰️📈
⚠️ Hypothetical Fibonacci/wave mapping — not guaranteed. Confirm each stage with real price action, volume, and momentum as it unfolds. NFA.


If Primary Wave III will be extended and assuming currently is Primary Wave II
🛰️ ASTS Wave III Scenario — Quick Recap
Base case: Wave III extends (~55-60% odds — 90% of Elliott extensions historically occur in Wave 3).
🎯 Primary Targets
Wave III: ~$395
Wave IV: ~$223 (50% retrace)
Wave V: ~$354 (simply constructed, ≈ Wave I size)
🔍 Wave III Sub-Waves
(i): $50 → ~$145
(ii): pullback to ~$98
(iii): acceleration → ~$252 (likely the standout leg — watch for volume surge/gap here)
(iv): pullback to ~$193
(v): final push → ~$395
👀 Confirmation Signals
Accelerating momentum vs Wave I, volume breakout above ~$134, gap-up mid-wave, clean overlap rules holding.
⚖️ Alternative
~30-35% odds Wave V extends instead (Wave III stays modest ~$180-200, Wave V runs $400-900+ on 2027-28 FCF inflection).
✅ Bottom Line
Base case: Wave III to ~$395, sub-wave (iii) (~$98→$252) as the key leg to watch.
⚠️ Hypothetical, not guaranteed. NFA. 🛰️
Operation🅰️TM retweeted

$ASTS - Price has moved:
👉🏼within a descending triangle-like shape, then
👉🏼flushes at support, and
👉🏼bottoms, before
👉🏼making new highs
This currently looks like 3 triangles within 1.
(Wouldn't it be something if Barney executed a DA like Bert and Ernie⁉️)


$ASTS - Record-breaking Capitulation looks like:
👉🏼highest volume, after
👉🏼low volume participation, with
👉🏼gap down, to
👉🏼close greater than -10%, and
👉🏼beneath the lower BB
Good news: below lower BB only lasts 1-4 days.
Better news: no more sellers (hopefully).

Operation🅰️TM retweeted

Average ARPU will likely be ~$10 a month globally
But, let's use all of your assumptions:
✅$5 ARPU and 1 billion users
✅$5 per month x 12 months = $60 a year
✅$60 x 1 billion users = $60 billion
✅80% operating profit = $48 billion
✅20x multiple x $48 billion = $960 billion
So that's $2,474 per $ASTS share, excluding the value of defense business, IP and L-Band spectrum
Also excludes inevitable AI data center optionality
$ASTS Weekly
1) Gann Square Monthly have not adjusted since 2024
2) Price tested the Gann Arc area twice before breaking out to new Highs
3) Yellow path is the Jan 27 '25 analog anchored to May '26 lows, White path is more conservative with full consolidation since Aug '24 anchored to Jan '26.
4) Upper Gann Arc Target $300-$412

Operation🅰️TM retweeted
$ASTS 3D
1) Last Aug 2024-May 2025 was a 9 month ranged box - Built a base before a huge 600% (7x) more or less move to the Jan 29, 2026.
2) Then we went down and tested $63 and bounced back up to $133 and rejected this pulling back to date to $72.58 presumably by the effects of SPCX and the Shorts
3) If we follow a similar pattern (Anchor Aug 14, 2024 Analog) it won't be until Oct 2026 (9 months from Jan 2026) before we break out to the upside for a re-rate rally towards $185-$235, and ladder up like in 2025-2026 towardsa $400-$500
Bigger the Base, Higher in Space

Operation🅰️TM retweeted

Execution in motion.
Another delivery to Midland. In the world's largest cargo aircraft, for the world's largest satellites in low Earth orbit.
BlueBirds 8, 9, and 10 are in orbit and operational; 11, 12, and 13 are next. Satellites in production through BlueBird 37.
Nearly 60 mobile network operators. Over 3 billion subscribers. World's first space-based cellular broadband network. Designed to connect directly to everyday smartphones.🌎📶📱🇺🇸
Built in Texas. Broadband from space. A market we invented.
#ASTSpaceMobile #Broadband #ConnectingtheUnconnected #BlueBirds
🛰️ $ASTS | J-LEO Award — Coming THIS WEEK
📅 Timeline:
• Apps closed: May 29, 2026
• Winner announced: End of June (June 23–26 window)
• Project value: ~$1B USD from Japan's MIC
• Coverage goal: Nationwide D2D by March 2029
⚔️ Two Consortiums:
• ASTS + Rakuten Mobile vs. SpaceX/Starlink + KDDI
ASTS edge:
✅ 98.9 Mbps on unmodified phones + Japan's 1st satellite video call
✅ JV announced June 22 — equal shares, within 2026
✅ Japan's regulatory draft report uses AST satellite imagery 👀
✅ JV structure lets KDDI, NTT DoCoMo & SoftBank join later
SpaceX edge:
⚠️ KDDI is Japan's largest MNO (more political clout)
⚠️ Larger proven constellation already in orbit
🎯 $ASTS J-LEO Win Probability: ~55–65% favor ASTS
🟢 Bull Case:
• JV announced day before award window = pre-notification signal?
• Japan wants sovereign network — ASTS JV structure fits perfectly
• Rakuten sold 50% ASTS stake + restructured fintech to raise capital
• Gov't tech report literally uses AST satellite images
🔴 Bear Case:
• KDDI >> Rakuten in political weight
• SpaceX constellation larger & more proven
• No hard deadline — could slip past June
💰 If ASTS wins:
• Award could EXCEED $1B (50/50 JV = full $1B flows into shared entity)
• Opens door for ALL major Japanese MNOs into ASTS ecosystem
• Follows US JV (AT&T/Verizon/T-Mobile) + Europe JV (Vodafone/Orange/Telefonica)
🗓️ Watch this week closely. Announcement imminent.
$ASTS 🚀🇯🇵


$ASTS
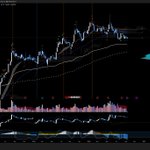
Daily: Prior Patterns kinda like W shape base. Livermore pattern here.
24H: Fat volume 39.6M daily, LBAF yearly open right at the Dec VPOC.
Island Gap reversal?


Operation🅰️TM retweeted

$SPX upd:
-Big picture remains unchanged: I am expecting a bear market with a buyable 3.5Y cycle low around Q3
-See below Dec 2024 projection with updated price
-20W cycle low came on time (1 day after ideal date of Mar 27 in pinned post)
-I didn’t expect new ATH: I thought we’d reject around golden pocket retracement. Between CTA mechanical bid and Trump playing the market like violin we have the blow off top I was expecting in Feb, market always finds a way to laugh at you
-The new 40d cycle is 1/2 way through and next week should tell us whether this rally has more upside or terminates here
-For my base bear case I had Apr 17 as turn date, but so far no signs of a slowdown in buying yet. Opex often provides a pivot in the cycle - or a few days after it.
-Based on Hurst method we still have potential several % more upside in $SPX which I’m not chasing as just like in Feb when I exited the market RR for a trader like me who likes holding positions for several months is not great and we have weekend headline risk.
-Timing wise next 40d low is due ~May 7 which should give us more info on the structure (depth of a pullback and strength of a bounce into late May) which then sets up bigger decline into a higher degree summer low.
-Leading indicators showing bigger decline is still ahead in a few weeks so staying cash heavy.
-If you want more updates - like and retweet


I’ve been waiting last few months for signs that 3.5 year cycle has topped. We’ve been buyers of dips as models were bullish. It has changed in Feb when I posted that I went mostly cash and now all models I track are now on a weekly sell signal / bear regime.
-The last time we had a similar set up was Dec 2021 and we went defensive before the bear market which positioned us well to be buyers of stocks at bargain prices later in 2022. Now current 3.5Y cycle is peaking/rolling over - time to pay attention.
-I don’t like playing Monday morning quarterback so I try to give you my actionable primary roadmap a few months out and adjust along the way based on cycles, models, technicals etc. Saying something was obvious after the fact doesn’t help anyone.
-Below is my experimental $SPX composite leading indicator which I’ve been working on for several years combining various cross-asset signals. Not meant to perfectly time every micro move but can be used as a confluence for larger trend changes
-In Dec ‘25 I saw upside headfake move (UTAD in Wyckoff terms) in Q1 2026 and then rollover; now with more data coming in it’s suggesting a bigger decline in Mar-Apr - in line cycles/ models / TA
- $SPX is still only -3.4% below ATH so real correction hasn’t even started. When talking heads on CNBC start panicking it will be too late. Not trying to fear monger, just calling it what models are showing. Capital preservation is key.
-I take time out of my weekend to post this to open people’s eyes to a potential significant downside in the market and consider contingency plans. If you find it helpful and want to get more updates - please retweet.

Operation🅰️TM retweeted
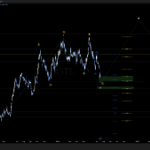
$ASTS
Who knew there was actually a trillion shares to offload out of nowhere?
Im not redrawing this chart, this is it, don't care
Next stop jump across the creek


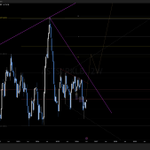
$ASTS
Gut says we are at Last Point of Supply either yesterday or today's session
Jump across the creek to follow..
