

The official Twitter of the Journal of the American Academy of Orthopaedic Surgeons (JAAOS)
- Tweets2.4K
- Following221
- Followers22.7K
- Likes1.8K






ALT This is an X-ray image of a pelvis with a prosthetic hip joint on the left side. The image includes labeled angles and measurements related to the hip replacement.


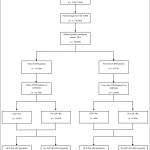
ALT This image is a flowchart detailing a study selection process for a systematic review. It shows the progression from identification to inclusion, with numbers of records at each stage: 4,258 records identified, 793 duplicates removed, 3,465 records screened, 3,424 records excluded, 41 reports sought for retrieval, 0 not retrieved, 41 assessed for eligibility, 36 excluded for using another surgical technique, resulting in 5 studies included in the systematic review, and 4 in the meta-analysis.


ALT A flowchart depicting the selection process of studies for a review. It starts with "Records identified through database search" totaling 2789, with 1169 duplicates removed, leaving 1620 records for screening. After title/abstract screening, 1281 records are removed. 339 full-text articles are assessed for eligibility, with 325 excluded for various reasons, such as article type, unavailable text, duplicate population, incorrect procedure type, no reimplantation, interstage procedures, and irrelevance. Finally, 14 studies are included in the review.

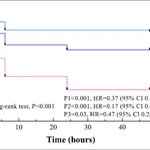
ALT Survival curve chart showing the percent survival of nausea over time in hours. The graph compares three groups: Preop 16mg, Preop 8mg, and Control. Preop 16mg shows the highest survival rate, followed by Preop 8mg, then Control. Statistical data includes log-rank test (P<0.001), and hazard ratios with confidence intervals for P1, P2, and P3.


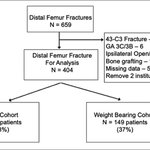
ALT This is a flowchart illustrating the analysis of distal femur fractures. It begins with 659 cases, narrowing to 404 after exclusions such as specific fracture types and missing data. The chart splits into two groups: the NWB cohort with 255 patients (63%) and the weight-bearing cohort with 149 patients (37%).


