
Anywhere but in between
Joined March 2011
- Tweets9.2K
- Following203
- Followers29.9K
- Likes2.1K
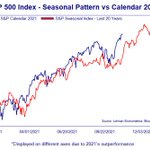
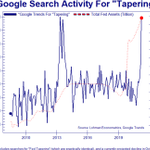
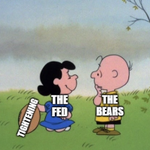





S&P 500 Seasonal Update - Continues to Track Historical Pattern
(reminder: YTD correlation is 94% bit.ly/3w5KDe0).


Speaking of Credit Market Dislocations, the China Junk Bond Market (which has been a leading tell) is Retesting Record Levels.
More Contagion Coming?

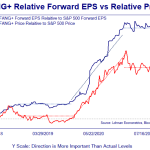
FANG+ Forward EPS Relative to the S&P 500 are stagnate/rolling over to the extent it's difficult to see them reasserting leadership, which is problematic for the market overall going into Q1 2022.

In the sh!tshow that was the action in global interest rates last week, Australia Two Year takes the cake with the highest upward move in at least 20 years


Not Jim Cramer retweeted

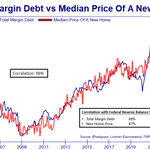
An almost surreal chart, but unfortunately that’s the reality we live in 👇 ht @Not_Jim_Cramer

Why would margin debt and home prices have a 96% correlation?
Because they're both risk-on responses to Fed Policy (courtesy @hedgopia).


Most sensitive areas of Risk-On/Risk-Off (last updated: bit.ly/3Gho4ba) broke to new highs Oct 13th and haven't looked back (tho clearly overbought).


S&P 500 Index is close to its seasonal pattern.
(FWIW, one of the most reliable seasonal setups over the 35 years I've been trading is a correction into October, followed by an October low, followed by a rally into the first week of January).


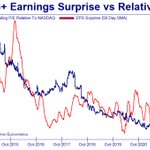
In an environment where EPS misses are getting hammered, it's worth noting that Earnings Surprises for FANG+ are approaching all-time lows.


