Physicist interested in Astrophysics & Particle Physics| Research in Math & Science Edu| Math & Science Writer| Teacher & Teacher Trainer| WomenInSTEM

Italy
Joined June 2007
Pinned Tweet
1/2 At the South Pole a research team from 30 institutions has recently put together one of the sharpest maps of how matter is distributed in the universe. It’s not a photo of galaxies: it’s made using the oldest light that exists, the light that’s been traveling for over 13 billion years. That light is called the cosmic microwave background, or CMB. It’s the glow left over from the Big Bang. As it travels toward us, every time it passes near large amounts of matter it gets slightly bent by gravity. By carefully measuring these small bends you can figure out how much matter is along the path, including the matter that doesn’t emit light. The telescope at the South Pole has the advantage of a very clear sky. Using data from the 2019 and 2020 seasons, over an area of about 1500 square degrees, the scientists got the most sensitive map of this kind made so far. It’s like a photograph with very little background noise: you can see the details of how the matter is distributed more clearly. This map mainly shows how “clumpy” the universe was at certain times, when stars and galaxies were forming. It lets us check if structures grew over time the way the standard model says they should. Put together with other observations, it also gives some clues about the total mass of neutrinos—those elusive particles that zip through pretty much everything and almost never interact. It’s not a perfect map. The authors themselves explain that some residual “noise” remains, caused by distant galaxies, hot gas, and small imperfections in the instrument. They corrected it as much as possible, but it doesn’t disappear completely, especially in the smaller parts of the map. Some choices about which scales to look at and how to model certain effects still influence the result a bit. When you try to go beyond the standard model there are still uncertainties—more hints than solid evidence. It’s still a useful step: it lets us test better how the universe grew and sets the stage for more ambitious measurements in the coming years. The data used are from only two seasons; they’re already analyzing more. #cosmology
4
12
3
17
562
Nereide retweeted
1/3 This marvelous Hubble image shows the N44 superbubble complex, a turbulent emission nebula dominated by a vast bubble some 250 ly across: the dark, starry area visible in the upper central region. Credit & info➡️nasa.gov/image-feature/godda… #scritturebrevi #VentagliDiParole
8
92
2
416
10,925
Nereide retweeted
1/2 A British-built magnetometer headed for a distant orbit could extend the usable warning time for the most severe solar storms. Operational space-weather forecasts currently rely on spacecraft at the Sun–Earth L1 point, about 1.5 million km from Earth. The fastest coronal mass ejections leave little more than 15 minutes before the magnetised plasma arrives—an interval too brief for many protective actions on power grids, satellites and communications systems. ESA’s HENON mission, a 12U CubeSat set to launch in early 2027 as a secondary payload with the PLATO telescope, will test a different vantage. The spacecraft will enter a Distant Retrograde Orbit (DRO) of the Sun–Earth system, a co-orbital yet more elliptical path first proposed by Michel Hénon in 1969 and never previously flown. On the sunward portion of this trajectory HENON will sit roughly 15 million km upstream of Earth—10 times farther than L1—sampling the solar wind and interplanetary magnetic field earlier. MAGIC is a miniaturised magnetoresistive magnetometer developed at Imperial College London. It is supported by the UK Space Agency through ESA’s General Support Technology Programme and will measure the magnetic field carried by the solar wind. Together with a Czech plasma analyser and a Finnish energetic-particle monitor, it will supply the data needed to check whether upstream measurements improve estimates of storm intensity. The orientation of the magnetic field inside a CME is still the hardest element to forecast and largely determines geomagnetic impact. If the results hold, the lead time for the strongest storms could grow from about fifteen minutes to two or three hours. HENON is a technology-demonstration mission, not an operational service. Its role is to qualify CubeSat systems for deep space and to test sub-L1 monitoring; continuous coverage would require a later constellation such as the one outlined in ESA’s SHIELD concept. The project is led by Argotec; Jonathan Eastwood of Imperial College presented the work at the Royal Astronomical Society’s National Astronomy Meeting 2026. Severe space weather already appears on the UK National Risk Register for its potential effects on critical infrastructure. HENON will not close the forecasting gap by itself, yet it offers a concrete step toward longer observational lead times and the technologies needed for more effective future alerts.
5
15
1
30
900
Nereide retweeted
NASA’s #Perseverance rover has broken the off-world driving record. On 11 Oct. 2026, it reached 45.22 km on #Mars, surpassing Opportunity’s 45.16 km. It hit the mark in five and a half years, compared with nearly 15 for its predecessor, on the 2,006th Martian day (sol) of the mission. Much of the credit goes to AutoNav: Perseverance maps the terrain in 3D while moving and picks its own route between points chosen by Earth. Over 90% of its total distance has been driven this way, processing 600,000 points per look versus Sojourner’s 20. It can cover up to 412 meters in a single sol. The record fell as the rover headed toward Idubi in the Lac de Charmes region on the edge of Jezero Crater, exploring some of the oldest terrain in the solar system in search of possible hydrothermal systems. The original plan called for no more than 20 km; systems remain fully operational and it will keep adding distance. Video Credit: NASA/JPL-Caltech More: jpl.nasa.gov/news/nasas-pers…
7
19
4
37
1,159
Nereide retweeted
In the early hours of October 13, 1985, in the CDF control room at Fermilab, the screens suddenly lit up. After weeks of only beam-gas collisions, the first proton-antiproton collision events at the Tevatron (1.6 TeV) appeared. At 2:52 a.m. the detector recorded a new world energy record. CDF (Collider Detector at Fermilab) was the large particle detector installed at the interaction point called B0 of the Tevatron. It was there that, that night, the researchers saw the first true collision events and began celebrating with sparkling wine (the internal message said "look for free bubbly at B0"). The image shows the CDF logbook page from that night: the signatures of the "CDF Crew," the notes, and a computer printout of the status message confirming the event and inviting people to celebrate at B0. Subsequent events confirmed that it was not beam-gas. That night the Tevatron Collider physics program truly began. Ten years later the two main experiments, CDF and DØ (the other large detector installed at a second interaction point), would discover the top quark. Photo: Fermilab History and Archives history.fnal.gov/historical/… Source: FermiNews Special Edition, October 23, 1985 history.fnal.gov/historical/… #physics #ScienceHistory
3
10
3
27
1,095
Nereide retweeted
Curiosity caught an extraordinary panorama at dawn on #Mars: the yardangs — wind-sculpted cliffs on Mount Sharp — lit by morning light. Shot 11 Aug 2026 at 8:30 local, no white balancing so the blue early-morning tones stay visible. The most detailed view ever. The rover has surpassed 1 km of elevation, a record on Mars, while climbing Mount Sharp since 2014. Scientists hope to reach the yardangs in 2027 to understand how they formed, perhaps from ancient volcanic ash. They look plastered on, wrong color and odd tilt, according to Vasavada. Credit: NASA/JPL-Caltech/MSSS nasa.gov/missions/mars-scien…
3
22
2
51
1,202
Nereide retweeted
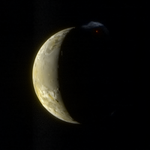
1/2 Historic view of Jupiter’s volcanic moon Io from New Horizons, at 2.3 million km. The red dot is glowing magma at the Tvashtar eruption site; the blue plume is fine dust particles lofted hundreds of km high and catching sunlight. A rare, detailed look at Io’s extreme activity from New Horizons’ Jupiter flyby. Io is the Solar System’s most volcanically active body, heated by intense tidal forces from Jupiter. This crescent image captures Tvashtar volcano in full eruption. The blue color comes from sunlight scattering off tiny ejected particles, much like blue smoke. Only the blue (~480 nm) & methane (~890 nm) channels of MVIC were usable: the red and near-IR filters overexposed on Io’s dayside because the instrument was designed for much dimmer Pluto. The high-resolution LORRI grayscale supplied the sharp detail that was then colorized with those two bands. Taken during New Horizons’ Jupiter flyby (closest approach 28 Feb. 2007; this view from the outbound leg on 1 March). The spacecraft obtained multiple views of Tvashtar’s large, structured plume, including the first-ever movie of an Io volcanic plume in motion. A key early result of the mission. At this range the LORRI resolution was roughly 11–12 km per pixel. Merging its sharp panchromatic data with the lower-resolution color information reveals both surface texture and the striking red-hot lava / blue dust contrast—an enduring image of Io’s violent geology.
7
21
4
55
1,668
Nereide retweeted
1/2 This amazing image by Don Goldman shows the central region of the open cluster NGC 2244 (Caldwell 50), in the heart of the Rosette Nebula (Caldwell 49). The cluster and nebula lie some 5,000 ly away in Monoceros. ➡️apod.nasa.gov/apod/ap140311.… #scritturebrevi #VentagliDiParole
15
219
5
1,465
38,244
Nereide retweeted
1/2 This breathtaking photo by Brent Mckean features a few atmospheric optics phenomena due to refraction, reflection and diffraction of moonlight from millions of falling ice crystals. The colored rings, reminiscent of soap bubbles and the vibrant plumage of peacocks, belong to a corona. This phenomenon is primarily caused by the diffraction of light passing through or around small water droplets or ice crystals in the atmosphere. Actually, the exact mechanisms behind the formation of corona colors are rather complex. You can learn more by following the links I shared in the second post. Outside of the corona, you can see a 22° halo with upper and lower tangent arcs visible at the top and bottom. To the halo's sides are visible moon dogs. The 22° halo is here created by moonlight refracting through poorly aligned hexagonal prism crystals, being so deflected through various angles. The deflection is due to the refraction of light at each face of the crystals. Moon dogs, also known as paraselenae, are formed when moonlight, passing through hexagonal-plate-shaped ice crystals in cirrus clouds or cirrostratus clouds, is refracted and reflected at an angle of 22 degrees, resulting in two bright spots of light appearing on either side of the Moon. In this case, they appear alongside the 22° halo. The tangent arcs are created by moonlight refracting through rod-shaped hexagonal ice crystals, with their long axis aligned nearly horizontally. They appear above and below the Moon, and here are tangent to the 22° halo. This vibrant scene was captured with three combined exposures on a cold winter morning in Manitoba, Canada.
8
36
4
101
3,600
Nereide retweeted
1/4 On August 27 in 2003, Hubble captured this image when Mars was at its closest approach to Earth in nearly 60,000 years. Olympus Mons, the solar system's largest volcano, appears near the top. ➡️bit.ly/3EKNmjl #scritturebrevi #ventaglidiparole
5
57
2
127
Nereide retweeted
1/2 Comet C/2023 A3 (Tsuchinshan-ATLAS), photographed by Andrea Cappe on Oct. 13 at 19:38 CEST, Roppolo, Italy. This is one of the most evocative captures of the comet I have seen. In a magical scene, some houses in Roppolo, Lake Viverone, the moraine of the mid-coast are visible together with the mountains of the Graian Alps, which look almost caressed by the coloured clouds at sunset. Image: Via Wikimedia Commons License: CC BY-SA 4.0 #CometC2023A3 #TsuchinshanATLAS
6
40
4
116
3,622
Nereide retweeted
2/2 Credit: NASA / JHU / APL / Gordan Ugarković flickr.com/photos/ugordan/60… References: - Spencer et al. 2007, Science: doi.org/10.1126/science.1147… - Cheng et al. 2008, Space Sci. Rev. 140, 189–215 (LORRI instrument): doi.org/10.1007/s11214-007-9… - Reuter et al. 2008, Space Sci. Rev. 140, 129–154 (Ralph/MVIC): doi.org/10.1007/s11214-008-9…
10
19
465
Nereide retweeted
1/2 This beautiful Hubble image features, in spectacular detail, NGC 6217, a barred spiral galaxy located some 60 million ly away in Ursa Major. Its evident feature is a prominent bar of stars across the center. Numerous pinkish regions, visible in the galaxy, are made up of hydrogen made bright by nearby massive stars. At the core of NGC 6217, spanning some 30,000 ly across, there is a low-luminosity active galactic nucleus (AGN) that has formed an H II region, an emission nebula associated with young, blue, hot stars. A supermassive black hole (SMBH) probably harbors in the AGN. Scientists believe that the barred spirals allow gas to be channeled from the disk towards the nucleus, triggering episodes of star formation and fueling the central SMBH. SN 2018gj is a Type IIP supernova that occurred on the outskirts of  NGC 6217. This galaxy is undergoing a high rate of star formation compared to a typical galaxy, so it has been characterized as a starburst galaxy. Image Credit: NASA, ESA, and the Hubble SM4 ERO Team
6
32
4
153
2,769
Nereide retweeted
1/3 In the nearby galaxy Small Magellanic Cloud, a massive star exploded as a supernova and dissipated its interior into a stunning display of colorful filaments. ➡️bit.ly/3g3C1R7 The supernova remnant E0102 is the greenish-blue⤵️ #scritturebrevi #ventaglidiparole
3
39
1
92
Sound on 🔊 A flythrough of our local Universe: 55,486 galaxies and 29,555 streamlines tracing the cosmic velocity field reconstructed from Cosmicflows-4 data. Laniakea, our basin of attraction, in red. Made with #python #pygfx
16
102
8
419
16,169
1/2 A British-built magnetometer headed for a distant orbit could extend the usable warning time for the most severe solar storms. Operational space-weather forecasts currently rely on spacecraft at the Sun–Earth L1 point, about 1.5 million km from Earth. The fastest coronal mass ejections leave little more than 15 minutes before the magnetised plasma arrives—an interval too brief for many protective actions on power grids, satellites and communications systems. ESA’s HENON mission, a 12U CubeSat set to launch in early 2027 as a secondary payload with the PLATO telescope, will test a different vantage. The spacecraft will enter a Distant Retrograde Orbit (DRO) of the Sun–Earth system, a co-orbital yet more elliptical path first proposed by Michel Hénon in 1969 and never previously flown. On the sunward portion of this trajectory HENON will sit roughly 15 million km upstream of Earth—10 times farther than L1—sampling the solar wind and interplanetary magnetic field earlier. MAGIC is a miniaturised magnetoresistive magnetometer developed at Imperial College London. It is supported by the UK Space Agency through ESA’s General Support Technology Programme and will measure the magnetic field carried by the solar wind. Together with a Czech plasma analyser and a Finnish energetic-particle monitor, it will supply the data needed to check whether upstream measurements improve estimates of storm intensity. The orientation of the magnetic field inside a CME is still the hardest element to forecast and largely determines geomagnetic impact. If the results hold, the lead time for the strongest storms could grow from about fifteen minutes to two or three hours. HENON is a technology-demonstration mission, not an operational service. Its role is to qualify CubeSat systems for deep space and to test sub-L1 monitoring; continuous coverage would require a later constellation such as the one outlined in ESA’s SHIELD concept. The project is led by Argotec; Jonathan Eastwood of Imperial College presented the work at the Royal Astronomical Society’s National Astronomy Meeting 2026. Severe space weather already appears on the UK National Risk Register for its potential effects on critical infrastructure. HENON will not close the forecasting gap by itself, yet it offers a concrete step toward longer observational lead times and the technologies needed for more effective future alerts.
5
15
1
30
900