

Reporting what's happening in ND. The news you don't always hear on other media sources. Supported by data. Topics you care about. Tools for you to use.
North Dakota
Joined August 2013
- Tweets3K
- Following130
- Followers354
- Likes492







🚜We’re harvesting insights into ND’s changing demographics!
🌱ND’s population is growing more diverse & the younger the generation, the greater the diversity.
📊In 2025, 1 in 4 youth under age 18 identified as a race other than White.
Dig into the data 🔗bit.ly/4A8ppfB

🌾🚜 This month’s article highlights findings from the 2026 Housing Needs Assessment:
👴How an aging population will shape housing demand
🏡 How rising costs are squeezing household budgets
📊 How affordability is a challenge despite economic growth
🔗 bit.ly/4BmVmCi

🌾It’s a Data Harvest! The October newsletter is out with new North Dakota data & research conta.cc/4idji3e
Inside:
🏠Housing Needs Assessment
👥Demographic shifts
💙Depression prevalence
📊Updated data
Read it here: conta.cc/4idji3e
#NDCompass #NorthDakota

🎉 Happy 1-Year Anniversary to the redesigned ND Compass website!
1 year ago, @NDSU CSR launched modern tools to make exploring reliable ND data and insights easier than ever. Thank you for growing with us!
Explore today: ndcompass.org #NDSU #NorthDakota #NDdata

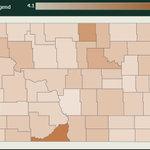
💚Adults across North Dakota report 4.1 to 6.2 days of poor mental health each month, depending on the county.
🧠This #MentalIllnessAwarenessWeek, take a closer look at the numbers & explore mental health data from across the state.
Find your county 👉 bit.ly/4j67WPv

🍁Fall into new & updated data & resources on ND Compass!
💼Take a closer look at the latest numbers to see what’s happening with jobs across the state: bit.ly/4i4mPAM
🏠Explore the latest income-based rental housing data on the Housing Portal: bit.ly/3Tqjgf0
Want to stay in the loop on North Dakota trends and insights? 📊
Subscribe to the ND Compass monthly newsletter to get data updates, research highlights, and community resources delivered straight to your inbox: bit.ly/3TA0fGL
#NDdata #NorthDakota #DataInsights

The state’s 65+ pop. has grown nearly 50% in 15 yrs. If current trends continue, over 1 in 5 North Dakotans will be age 65+ by 2034.
This article takes a closer look at the data—& how communities across ND are experiencing major demographic shift.
👉bit.ly/4rzGrjm

ND recorded a 4% increase in births in 2025, surpassing 10,000 births for the 1st time since 2021.
The percentage of babies born at a low birth weight dropped to 6.7% - lowest in 4 years.
Explore birth data & what’s happening across various demographics: bit.ly/4hwoVI5

💼👩💼 #PopQuiz
In 2025, what was the percent change in the total number of jobs in North Dakota compared to 2024?
a) -0.8%
b) 0.2%
c) 1.7%
d) 2.5%
Answer: ndcompass.org/quiz-of-the-mo…
#NorthDakota #NDdata

🍂 Our September Newsletter is out! 🍂 conta.cc/4gM4zvG
Catch up on the latest North Dakota trends & data:
• Shifting demographic & aging trends
• ND birth count & health stats
• Updated jobs & economic data
• Honoring Project Director Ina Cernusca’s retirement!

🎉After over a decade with us, our dear friend & colleague Mihaela “Ina” Cernusca has retired!
Her leadership, expertise, and dedication have left a lasting impact on ND Compass & beyond.
Please join us in thanking Ina & wishing her all the best in this exciting new season!🍂

Ready, Set, Slide: Dive deep into our housing data!
Two NEW home sales dashboards were recently added to the Housing Portal!
ND Multiple Listing Services (MLS) Transactions: bit.ly/4wLeuqP
ND Sales Ratio Study Transactions : bit.ly/4pZVHp3

Happy #LaborDay to every hand that builds, creates, teaches, heals, & serves!
Our team is back from a well-deserved long weekend recharged & ready to analyze new data. Shoutout to everyone keeping the momentum going this week & stay tuned for what we have coming in September!

ND Compass has essential new data updates, refreshed interactive dashboards, & newly analyzed statewide trends!
Discover what's new & explore the full list of updates & direct links in the "New & Updated Data & Resources" section of our latest newsletter: bit.ly/3UJLlOr

In North Dakota, what percentage of 8th graders scored at the Proficient or Advanced levels on the 2025 State Math Test?
a) 35%
b) 45%
c) 55%
d) 65%
Answer: ndcompass.org/quiz-of-the-mo…

Finding quality child care for some ND families is simply about availability and not a matter of preference.
August’s featured article highlights findings from the 2025 Annual Market Rate Survey of all licensed child care providers.
📖 Full Article: bit.ly/3UdN1jb

Childcare is essential for families where all parents in the household work!
The state avg is 1.6 children per spot, county rates vary:
🧸 Some have enough capacity
⚠️ Others face nearly 13 children per spot
🚨 2 counties have 0 spots
Find your county: bit.ly/4hwoVI5

A Backpack Full of Data: The August 2026 ND Compass Newsletter is Live! conta.cc/460A4eX
As school starts, stock your data toolkit w/the latest insights on child care capacity & access, interactive dashboards & statewide trends.

🏡 Big news for ND communities, leaders & researchers! 📊
In partnership with the North Dakota Housing Finance Agency, @NDCompass (@NDSU) added 2 NEW Home Sales Transaction dashboards:
🔹 MLS Transactions: bit.ly/4wLeuqP
🔹 Sales Ratio Study: bit.ly/4pZVHp3
