

✨ 🎨 Science Illustrator #dataviz #scicom #illustration 👩🎓 🌲 PhD #ecology #biogeochemistry #biology 🦋https://xitter.cf/t.co/Sw3boFYkIH
Turku, Finland, EET
Joined November 2014
- Tweets428
- Following505
- Followers222
- Likes1.1K




Pinned Tweet
More action from me in LinkedIn and BlueSky
🔗linkedin.com/in/nuriaaltimir…
🦋@naltimir.bsky.social
Things I do

New Research: Engaging with uncertainty when engagement is uncertain frontiersin.org/articles/10.… #FrontiersIn #Bioinformatics

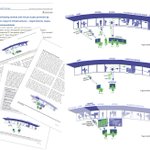
Thanks @eRImote_EU for letting me contribute with schematics to your green paper published last spring. erimote.eu/green-paper
Infrastructure use by access type: remote access, virtual access, and remote training.
#sciart

Núria Altimir retweeted

Erittäin lupaava viikonloppu on tulossa revontulten näkymisen kannalta. Mallinnusten perusteella pe-la yöllä painopiste on aamuyön puolella, mutta la-su voi olla aktiivisuutta jo heti pimeän tultua.
Lyhyen aikavälin tilannetta voi seurata osoitteesta rwc-finland.fmi.fi/
Happy to see this work in the wild. I contributed with some layout and design work and of course dataviz 😉👍🏻📊 #dataviz #scicomms

🙌Delighted to share our #AnnualReport 2023 with you, including highlights from an exciting, pivotal year!
▪️2 new members 🇪🇸🇧🇪
▪️A Strategic Plan 🎯
▪️Inspiring user stories 👩🔬
▪️Growing impact 📈
▪️Amazing research & innovation at our Nodes 🔬
Read it⤵️
eurobioimaging.eu/news/the-e…
SDG data portrait
Full poster nuriaaltimir.com/projects/sd…
#SDG #FutureFridays #DVS #dataviz #infogr8 #infgrafics #scicom

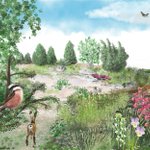
I went drawing a bit of spring action. Took the wrong color pencils with me but oh well. Enjoyed the process. "Hepatica nobilis blooming through dead leafs"
#sciart #illustration #nature

Hi #PortfolioDay! I am a scientific illustrator and information designer. I craft visuals to display your research and innovations. From figurative and numerical to abstract, whatever suits better your message.

Visiting #ChemBio2024 in Helsinki this week.
Scientific illustrations, data visualization, and visual communication for your research and innovations.
Contact me for a chat!
Laita viestiä niin sovitaan tapaaminen. Nähdään!


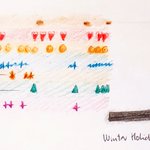
📊Data does not necessarily have to be worked primarily via software. Physicalization is another way of showing data and here I bring and example with a piece of mine.🧶
@DataVizSociety #NightingaleInPrint
#scicomm #dataviz #embroidery #dataphysicalization

One of my illustrations in the wild. This one did not make it to the final article but it goes to good use nonetheless
Congratulatios to @SorianoRedondo for the article publication
This Post is from an account that no longer exists. Learn more
Aaaand... figure reviewers more needed than ever!
This Post is from an account that no longer exists. Learn more
Here listening

Tutkijoille avaimia yhteiskunnalliseen vaikuttamiseen🦉💡
Tiistaina 13.2. klo 9 kerromme Tutkijan käsikirjan taustoista, keskeisistä viesteistä ja erilaisista työkaluista.
Ilmoittaudu mukaan webinaariin➡️ bit.ly/3SYsbkQ
acadsci.fi/julkaisut/tutkija…
Congratulations on the publication.
Happy to have assisted styling @lukas_kohl draft for the summary table and discussing colour choices. 😊🎨
#scicomm #sciart

Our recent paper out now🥳🍾: Radiation and temperature drive diurnal variation of aerobic methane emissions from Scots pine canopy | PNAS @lukas_kohl @SallaTenhovirta @KoskinenMarkkuI et al. @helsinkiuni @INAR_fin @CH4_N2O_Forests pnas.org/doi/10.1073/pnas.23…

Holiday highlights.
We had perfect plans. The flu did not agree.
Got well just on time to come back.
(sigh)
5-minute sketch series. #everydayviz #vizeverydaylife

Sometimes, I draw people 😁
Whatever you need for your grant writing, I got you.
#infographic #scicomm #human #scienceillustration #nature #natureillustratrion #grantwriting

This was my entry to #ESAlittlePic
Build with data from ESA Permafrost Climate Change Initiative (Permafrost_cci): Permafrost Ground Temperature for the Northern Hemisphere, v3.0.
#permafrost #Datavisualization #SciComm

Have you ever seen aerial pictures of tundra? Beautiful! My figure does aspire to look like that but I build it as an evocative abstraction.
The temperature time-series is shown in several channels, scaled within the max-min values of the series: