

Creator of the 'Matrix Daily Edge' Author of 'Fractal Market Mastery' Contributor to 'Seeking Alpha' See pinned tweet for free trial / Substack
UK
Joined January 2011
- Tweets58.4K
- Following49
- Followers31.5K
- Likes3.1K







Pinned Tweet
The Matrix Daily Edge is published before each US session and outlines actionable ideas, directional bias, and important levels in the S&P500, commodities, crypto, and others. Free Trial - mailchi.mp/888cf8615120/free…
Now also on Substack - matrixdailyedge.substack.com

Today's Daily Edge updates the long-term charts, proposes a path into the midterms, updates oil, QQQ and SOXX, and said this about today: "There should be a few swings in this range and the simple view says that the first leg up is complete at 7723 and a dip should set up a second leg to exceed it. The 7680s should really hold a downside spike at the open for that to play out"
matrixdailyedge.substack.com…

The week before Black Monday looked like the blue line on the above chart and close dead on the lows. Kinda gave a warning, no?

Interesting, but worth noting the SPX was down around 10% in the 3 days before, and it was below the 200sma. Last week, the SPX was down less than 2%

Today's Daily Edge compared today's set up to Monday's session - failed new high followed by a slow session. Free now on Substack - matrixdailyedge.substack.com…

Not gonna lie - yday was pretty painful. But this is X, so I'll ignore that and talk about how good today was. This is from today's Daily Edge: "Look for an undercut of 7693 to the 7670s and a recovery above to set up the usual Thursday bounce and Friday recovery. That should get to 7750ish"
SOXX Semiconductors down 8 days in a row, but only on bar 6 of a daily Demark exhaustion signal.
Gave me a nasty loss yesterday.

Today's Daily Edge looked at why this sell off is not about Wednesday's CPI, but about AI concerns and de-risking into the midterms.


funny thing is, at this rate, semis will pull everything down and SPX will be lower than it was when breadth was much worse

Semis / SOXX update.
So, it was a complete ABC rally after all?!
Potentially bearish, but various options in this range.
Support at $538-540

Semis (SOXX) has now reached equal legs from the July bottom at $598. Is it a complete ABC or will it keep going? A key question for broader market. Chart below is from September lows just before the breakout

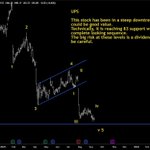
I'm pretty good at bottom fishing, but tend to hold too long. Remember it's a bottom for a bounce in a downtrend, not a bottom forever. Still holding some UPS after catching the low perfectly and giving nearly all of it back.


This week's expectation is for more of the same.
The pattern is surely forming a wedge, but that could go on for longer than many think.

Last week I talked about a turnaround in breadth. Is this this this the start? ADL cumulative breakout.

