


Matias retweeted

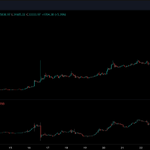
$CrvUSD just hit 19.4k in fees today.
Two straight weeks of rising fees and revenue
Clear signs of accelerating adoption and strong user demand
Curvism

Matias retweeted

WTF is BAMM?
@fraxfinance just dropped BAMM (Borrow Automated Market Maker), and it’s about to flip the DeFi game.
Whether u’re an LP trying to max out ur yield or a degen borrowing w/o the risk of getting liquidated, BAMM could be ur new best friend. 🧵👇

Matias retweeted

Bitcoin $100K Watch xitter.cf/i/broadcasts/1DXxydaeN…


Matias retweeted

Money is not valuable
The only way you create wealth is by inventing ways to increase output per unit of input; this is wealth creation
Inventing a tool, a knife, farming, steam power, jet fuel, steel, nuclear, silicon chips - these are step changes in getting more output per unit of input. The civilisations that invented these became immensely wealthy
Because they had more output for the same input
The west has largely forgotten this and the system is now slow, uncompetitive, over-regulated, stale
The bright light is technology, mostly concentrated in America. Europe has been afraid of this and concentrated on socialist, “green” nonsense hence the dramatic underperformance in wealth creation compared to the US
Your value should not be saved in fiat. Fiat is controlled by other people who use it to steal your output and spend it on military control and to bribe people that aren’t you to support their power
If you live amongst this and you produce output, you can save in #Bitcoin, which is a way to save the value of your actual wealth creation over space and time, which cannot be controlled by enemies
Matias retweeted

Morning folks! As promised, gonna kick off my partnership with @Bybit_Official with a new iPhone 15 giveaway.
To enter you must:
1. Like and retweet this post
2. Complete the Google form here: forms.gle/D86K6Sqxwf4rvj9z8
Note: If you have previously registered for an account with my ref link before today you are still eligible for the giveaway if you complete the form above and meet the rest of the requirements.
Campaign will run for 30 days, winner will be announced within two weeks after.
Goodluck!


Excited to announce that I have officially partnered with @Bybit_Official.
Will be kicking this partnership off with an exclusive giveaway for my followers within the next 24 hours so make sure you have tweet alerts on 👀
As always, I appreciate all the support frends.

Matias retweeted

🚨We have identified and removed a malicious version of the Ledger Connect Kit. 🚨
A genuine version is being pushed to replace the malicious file now. Do not interact with any dApps for the moment. We will keep you informed as the situation evolves.
Your Ledger device and Ledger Live were not compromised.
Matias retweeted
Lots of mixed responses in the comments. Here is my step-by-step approach and breakdown of the chart to explain my thoughts and how I would approach this:
We can start off by identifying key swing highs and swing lows- these are the levels marked off as "LOW" and "HIGH" in the chart below. We then look to see which of these levels has been broken during subsequent PA. We can see that our "LOW" has been broken (making a lower low) and our high remains unbroken (making current PA a lower high). At this stage, and at the highest level visible on the chart, we can conclude that we may be in a potential downtrend.
Now let's look at what else we can see to determine if it's likely that this downtrend continues or if it's more likely that the trend is broken. To answer this question, let's looks at logical draws on price (liquidity) and see if we can easily identify the path of least resistance for price to move towards:
On the chart below, I've marked off the two logical areas where we can expect resting liquidity with a RED X- the untapped/unbroken highs above us and the series of higher lows below us (near the bottom of the range).
I've also marked off some price zones in red and green (some call them gaps, or fair value gaps- same thing) to help identify regions in which PA moved inefficiently.
What does this means and why is it important?
To simplify, imagine if you had a market with 100 buyers and sellers. 45 of them are interested in buying/selling at the range lows and 45 are interested in buying/selling at the range highs, but only 10 are interested in buying/selling in between. As price moves to the range highs and range lows we see lots of chop/trading as buyers and sellers duke it out to determine fair value. As price moves into the middle of the range, there aren't many who are willing to transact at those prices, so the books are thin, volume is low, and price quickly moves through these zones with little resistance. This inefficient PA as we like to call it is often revisited and price often traverses through these regions quickly when it does because of the lack of buyers/sellers in these zones. This also means that these zones don't do well as support/resistance. In other words- clusters of consolidation where lots of trading took place will often act as support/resistance whereas the inefficient moves between clusters of consolidation are often easily moved through with little resistance.
Now applying that idea to our chart above, we can see that the inefficiency left behind by price in green has been FILLED (meaning price has revisited it and "patched" the inefficiency) whereas the inefficiency below us in red remains unfilled.
We can also see at the top left corner of the chart, that we have some more significant inefficiencies above our range altogether- so do we target the RED inefficiency below us or do we target the GREEN inefficiency outside/above our range?
Let's take a closer look at PA to help us answer this question:
If we look at where our reversal at our lows occurred we can see that smaller TF wicks below the range were bought up. These are signs of absorption (buyers stepping in to support price at these levels). If we look at where we are now, we can see the same- sellers stepping in to sell at these prices, the same way buyers stepped in to buy at the lows. This tells us, that while we do have some inefficiencies above our range, at this time, sellers are stepping in at the range highs and there is increased sell pressure at these levels which may prevent the range highs from being broken and the inefficiency above from being filled.
Because of increased sell pressure at these levels (evidenced by the wicks to the upside) the path of least resistance (at least in the immediate short term) may be down- and because of the large looming inefficiency below us it shouldn't take much downwards PA for price to completely reverse this entire last move up and fill the inefficiency below us.
Putting this all together, let's take a look at what my expectations are here based on the logic shared above:
With all this being said, it's important to understand that there are no guarantees in markets and the above is a logical conclusion based on the data that we can see on the chart (which in and of itself encompasses all known market information at any given time) but by no means a guarantee. We CAN see something different play out. Some have suggested a move above the range highs as a range deviation before continuation down, others have suggested a move above the range highs to fill the large inefficiency in the low 20k's- all of these are certainly viable possibilities- however- until the range highs (marked as HIGH) are breached, neither of these scenarios can come into play which is why my primary expectation is the one shared above.
I hope you enjoyed this post, if you liked it and/or learned something from it please like, share and comment. It let's me know that these posts are of interest to my followers and encourages me to produce more of them.
Thanks for the support!
PS. The chart above is inverse BTC- meaning its the BTC chart flipped upside down. So, a move down on this chart means a move UP on BTC in real life and vice versa. Hopefully this helps sheds some light on why I'm bullish on $BTC at this time (I always have a reason for "number go up").


Matias retweeted
You guys smashed it on my last post, nearly 2000 likes in under 24 hours- so as promised, here's a short and sweet 14 minute video update on $BTC and recent price action.
This one is a banger, please like/share/comment if you enjoyed it- keeps me motivated to keep pushing content like this out.
With that being said, enjoy!
A $7000 move up followed by 2 weeks of consolidation with bears not even able to get a 30% retracement is generally bullish af.
Get this tweet to 1000 likes I'll make a new update vid on $BTC for you all when I wake up in the AM :)

Matias retweeted
I don’t believe so you can find it here: coinalyze.net/bitcoin/open-i…
Matias retweeted
Pictured below is a key metric I will be watching in the coming weeks to help identify when our bottom may be in and when we may be ready to start our next impulsive move to new all time highs. This is a long post BUT trust me you will learn a lot if you take 5 minutes to read it👇
Pictured below is a cha price with another chart of aggregate open interest below.
We can see that every time aggregate open interest hits about 10B, it tends to mark a local top and every time aggregate open interest hits about 6B, it tends to mark a major bottom.
So what is aggregate open interest and why is there this type of correlation?
A simple way to interpret aggregate open interest is that it is a measure of the total amount of leveraged positions currently open across all included exchanges.
In other words- the higher aggregate open interest is, the more "frothy" the markets are as there is a larger amount open leveraged positions and these levered positions are all susceptible to liquidations if price moves against them.
So at periods of time when the market gets too frothy and open interest is at higher levels (in this case around 10B), we often see some sort of violent move that causes a spike in volatility as the market seeks liquidity and leveraged players/positions are liquidated.
If/when these players are liquidated, their levered positions are forcibly CLOSED, and this causes aggregate open interest to drop.
When most of the leverage has been flushed out of the system (in this case around 6B)- liquidations occur much less frequently which means volatility decreases and the price can then move back up (or down, depending on the trend) in a healthy manner.
So what can we do with this information and what does it tell us?
First off, at current levels, leverage is not extremely high or extremely low- we have found ourselves at the middle of our range- so what I am looking for now is a move to either extremity.
I have drawn two paths (green arrow and red arrow) that would likely take us to either extreme of our range.
RED ARROW (preferred): This path would occur if we continued down to the mid to low 20k region from current levels- a further flush down to a logical retest level (25k) with some potential wicks below from cascading liquidations (wicks into 23-24k are fine) that would ideally flush out remaining levered players and bring us back down to a minimally leveraged (healthy) market environment from which we can continue on our way up to 30k+ and ultimately new all time highs.
GREEN ARROW (alternate): Alternatively, if we continue up from here without getting a proper flush to 25k levels and aggregate open interest continues to climb and approach 10B as we push back into the 30k's- we have to remain cautious as it may simply be another fakeout to bait aggressive players in before a larger OI flush to sub 25k occurs.
Finally, is there a situation in which we DON'T need to revisit 25k and below and simply continue up and leave 25k and below untapped?
Yes, but in order for this to happen we would need to move up WITHOUT OI rising too much which would indicate that the move up is primarily spot driven, which is healthy and sustainable.
Overall I prefer the RED path as it would give us a visit to a logical support level and weekly bullish retest, while wiping out any excess froth from levered players which would allow us plenty of room to continue this healthy uptrend to new all time highs.
If you liked this post and/or enjoy this type of content, likes and retweets are appreciated!


Matias retweeted
We are LIVE. Newest Youtube video has just been released. Please like, share and subscribe if you enjoyed it!
Timestamps are in the video description BUT I HIGHLY recommend watching the whole thing- you won't regret it.
Enjoy:
youtu.be/uAVlOfpxRMQ
Matias retweeted

Calling all Digital Artists! Always wanted to create a PFP project but don't know where to start?
Receive coaching from top web3 mentors by applying to 'Avaissance' - Avalanche's newest Artist-in-Residence Program to get mentorship, resources, & support to launch your project!


Matias retweeted

Gary Gensler getting grilled on whether he thinks ETH is a security or commodity
Enjoy