Martín Pons retweeted
🔥A petición popular he actualizado los mapas con los incendios hasta la fecha de hoy.
Ahora podréis ver los incendios de:
🇪🇸#IFSierraOeste, #IFBurgohondo y #IFSanMartíndeValdeiglesias
🇫🇷 #Gironde (Burdeos)
🇬🇷 #Beocia y #Ática, próximas a Atenas
👉 miraidata.es/en/blog/incendi…
A new visualization for last week's #tidytuesday. This time is about online chess games. This one is better suited for big screens 🙂
Este año nos hemos saltado el invierno, directamente
#PalmaDeMallorca #IllesBalears #DataViz #WinterInPalma
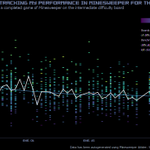
Joining the self-tracking trend I've been tracking my Minesweeper performance, a pastime I used to play a lot but not so much now. Hoping for better times once I get a mouse pad😅 #DataViz #SelfTracking #Minesweeper #MetricsThatDontMatter
The online course by @_MiguelHernan has been a great way to get introduced to causal inference using DAGs 😀Now I'm excited to explore additional avenues and deepen my understanding. #CausalInference
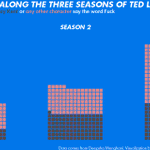
After quite some time, I'm back with a #tidytuesday visualization. This time, I'm exploring the show Ted Lasso using a grid chart. By the way, Ted Lasso is an outstanding show that goes beyond the usual surface-level humor found in comedy series. Definitely, worth a watch.

ALT Three grid charts representing the number of times the word fuck has been said by Roy Kent or any other character in season of Ted Lasso. This goes from 150 times in the rist season to 377 in the third and last season. While the increase from the season 1 to season 2 is causend maily by Roy Kent, the increase from season 2 to 3 is caused by the rest of the characters.

Martín Pons retweeted
I’ve written a textbook on improving your statistical inferences. It consists of the content I teach in workshops, and combines material from my MOOC’s, blog, and published work. It’s a free open educational resource: You can read it here: lakens.github.io/statistical…
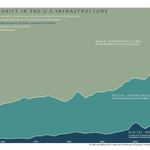
I retook a #tidytuesday plot that I left half done a few weeks ago. This one is about infrastructure.
#ggplot #Datavisualization
Link to the article
bea.gov/system/files/papers/…
Martín Pons retweeted
I am *overjoyed* to announce that our newest @OpenIntroOrg book "Introduction to Modern Statistics" (co-authored with the fantastic @jo_hardin47) is out!
🔗 openintro.org/book/ims/onlin…
Read the 🧵 for more!
1/n
#statsed #datascied #rstats #openeducation #OERR
I used last week's #TidyTuesday data from @AskAManager to visualize manager salaries in data jobs
#dataviz #ggplot2 #RStats
Martín Pons retweeted
Avui el @goib ha publicat un visor amb les #DadesCovidIB. Una molt bona feina per part de @SalutGOIB:
caib.es/sites/covid-19/ca/vi…
I practiced interactive viz. with last week's #tidytuesday data using #ggiraph just to check if it's as cool as it looks.
It turns out it's even cooler
#ggplot #dataviz
Martín Pons retweeted
This is now possible here gogiveone.org
Via 'Go Give One' – created by the WHO Foundation – you can now directly donate to COVAX and thereby make vaccines available for people in countries that cannot afford them.
Replying to @MaxCRoser @gavi
One more question if you don't mind, many people here ask me whether they can donate to support COVAX directly.
Is that possible?


