I find the signals Wall Street hopes you miss. Trader. Risk manager. USIC Verified. Coco's human. #1 Dad. YouTube: Figuring Out Money
Joined May 2009
- Tweets17.9K
- Following582
- Followers50.3K
- Likes13.7K




Pinned Tweet
Many people are saying we're in a bubble.
Here's what the 2000 and 2007 tops had in common. Different causes, same sequence:
1. Yields topped first
2. Stocks topped second
3. Commodities topped last
If something bigger is coming, this may be the order to watch.

Tony Stawk Pro Trader

Tony Hawk skateboarding in a suit and Bam Margera running around in a penguin costume at the NYSE
You’ve outdone yourselves, @tryramp
Here is the updated chart of the analog I have been tracking. I don't expect this to be perfect. However, it did give us great insight into the potential of a pivot/turning point in yields while they were going completely vertical.


Voila!

The big advance in rates this past month is still following the 2018 analog shared previously. Today, many names that were hurt by rising rates saw strength as rates backed off a bit.
Home Depot $HD was one of them, up 3% on the day and breaking out of a downward sloping trend.


Did you watch last nights mStock Market Report. Mentioned some stocks in there and setups.
youtu.be/LoDJMGsKRv4


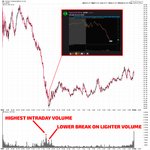
When $VZ really started selling off, I was watching for a higher volume spike to signal a potential capitulation.
When it came, price shortly after made another intense 1 minute bar lower. This time, however, it was on much lighter volume.
This is why I put it on watch at that specific time for an intraday bounce.


The big advance in rates this past month is still following the 2018 analog shared previously. Today, many names that were hurt by rising rates saw strength as rates backed off a bit.
Home Depot $HD was one of them, up 3% on the day and breaking out of a downward sloping trend.
The S&P 500 hasn't closed down 1%+ in 49 straight sessions.
Last time we saw a streak this long? July 2024 (52 days), which was followed by a 8-10% correction into early August.
Before that? Oct 9, 2019 → Jan 24, 2020 (74 days) without a 1% down close, right before the COVID crash.
This is NOT a crash call. It's an observation.
H/T: Tier1Alpha

Mike retweeted

Weekly expected moves for $MAGS curtesy of @MarketMike. I watch his vids every week, great data and expected moves i watch every week as crucial levels.

I'm so grateful for the support so far, we're halfway to our goal. Every donation helps us get closer to making a real difference in the fight against cancer. If you're able, please consider donating or sharing this with others, your support means the world. Thank you! 💙 gofund.me/2c2277fbd
My Milage Update:
22.5 / 100