

Inspiring action with nonpartisan data & trends. Led by Wilder Research. Backed by a collaborative of foundations. Tweets: @sheri_holm
- Tweets15.7K
- Following2.9K
- Followers5.4K
- Likes5.2K









ALT Image shows a talk bubble filled with the titles of the Minnesota Compass Insights articles published in 2024. Below it is a very large "WHAT DID I MISS?!"

ALT The image says "Minnesota Community Survey results: Feelings of Safety" and shows three donut charts. The first donut chart shows that 85% of Minnesota adults feel safe in their community. The second donut chart shows that 74% of Minnesota adults are not deterred by the fear of crime, and the third donut chart shows that 36% of MInnesota adults report their community is less safe." Underneath the three charts it says "Source: Lumaris Minnesota Community Survey, 2024."


ALT Image says "Take the Compass Quiz" and includes an illustration of a magnifying glass focused on a bar and line chart.

ALT Photo of a man walking down a street, he is silhouetted by the sun behind him. Photo by Kasper Rasmussen on upsplash.

ALT Image says "Here's the latest" and includes a screenshot of the December 2024 issue of Compass News.

ALT Photo shows Idris Mohamed of African Economic Development Solutions meeting with a client at an African grocery store. The female client wears an orange jilbab.


ALT Screenshot of mncompass.org home page. It shows the Compass logo and the menu of About, Explore the Data, Insights & Analysis, Resources, and Contact, as well as three search menus: Who lives in MN? Find data by community, and What's our quality of life?

ALT Screenshot of search filters for Minnesota Compass leadership program directory, which includes program focus, participant focus, area served, cost range, duration, leadership role focus, sector, leadership stage


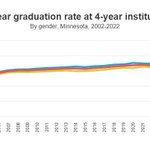
ALT Trendline chart shows six-year graduation rate at Minnesota's 4-year institutions by gender, 2002-2022. The trendline shows rate increases for both female and male students in the last two decades. Read data at https://www.mncompass.org/chart/k330/postsecondary-degree-completion#1-8189-d

ALT Bar chart shows six-year grad rate at 4-year institutions by racial and ethnic group in Minnesota, 2022. Rates are: American Indian: 37%, Asian or Pacific Islander: 67%, Black: 48%, Hispanic: 58%, International students: 68%, other or unknown race: 57%, two or more races: 61%, White (non-Hispanic): 70%, Minnesota (all): 67%.

ALT Chart shows comparison six-year graduation rates at 4-year institutions for both Minnesota and the U.S., 2002-2022. The trendline chart shows both rates increasing in the past 20 years. Read data at https://www.mncompass.org/chart/k330/postsecondary-degree-completion#1-8184-d.

ALT Image shows a magnifying glass over a bar chart. There's also a black circle with the words "Take the Compass Quiz," with mncompass.org underneath it.


ALT Image is a trend line chart of leaders who are veterans by sector in Minnesota, 2008-2022. It shows four lines of data. All people over the age of 25, all leaders, business leaders and government leaders. All show a decline in the past 15 years. Get the data at https://www.mncompass.org/leaders-veteran-status-0#0-15098-d
