

Astronomer | Science communicator | Adult Lisa Simpson | Education & Outreach Scientist @stsci supporting #JWST | Views are my own | @kellylepo@astrodon.social
- Tweets2.5K
- Following521
- Followers945
- Likes11.8K






ALT An image of the dolphin head nebula. Text on top "So Long, and Thanks for All the Fish"

ALT Poster for Astronomy on Tap Baltimore event on January 31, 2023. Poster text: Astronomy on Tap Returns. Free & Accessible Talks about Space from Scientists in Bars. How Baltimore Runs the James Webb Space Telescope. Kelly Lepo: JWST’s First Look at the Universe. Joe DePasquale: The Art & Science of Creating JWST’s Images. Sarah Kendrew: Getting JWST Working. 31 Jan 2023, Guilford Hall Brewery, 1611 Guilford Ave, Baltimore, MD, 7:00 pm. Background of the poster is the JWST Pillars of Creation image.

ALT Graphic titled “Centaur 10199 Chariklo Occultation Light Curve: NIRCam Filter F150W.” At the top is a diagram showing the change in relative position of a background star with respect to an icy body and its rings. The star appears to move behind the rings at two points along the path. Below the diagram is a graph showing the change in relative brightness of the star between 9:33 a.m. and 9:41 a.m. in Baltimore, Maryland, on October 18, 2022. The diagram and graph are aligned vertically to show the relationship between the relative position of the background star and the object and rings, and the measurements on the graph. The graphic shows that the brightness of the star is constant except when it appears to pass behind the rings, at which point it dips sharply. The graph shows two deep, narrow valleys when the star is partially blocked by the rings.

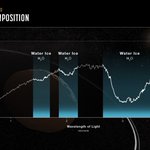
ALT Graphic titled “Centaur 10199 Chariklo: Surface Composition; NIRSpec PRISM.” The graphic shows a reflectance spectrum in the form of a graph of the Brightness of Light (relative reflectance) on the vertical y-axis versus Wavelength of Light in microns on the horizontal x-axis. The spectrum is plotted as a continuous jagged white line. The overall shape of the line is curvy, with broad peaks and valleys. Three prominent valleys are highlighted in blue and labeled “Water Ice, H2O.” In the background is a grayscale illustration of Chariklo and its rings, as seen from an oblique angle.

ALT A black background is filled with distant galaxies in different shades of a red, orange, and blue. In the foreground and taking up most of the image are blue, smokey, translucent wisps. They enter the image from the bottom left make their way through the center before going out toward the top. On the left top side, some of the wisps are orange and white. Below them are four bright points of light, which are stars. Three are orange and the one at far left appears orange-white. The stars have Webb’s signature 8-point diffraction spikes, which are also orange.

ALT Poster for Astronomy on Tap Baltimore event on January 31, 2023. Poster text: Astronomy on Tap Returns. Free & Accessible Talks about Space from Scientists in Bars. How Baltimore Runs the James Webb Space Telescope. Kelly Lepo: JWST’s First Look at the Universe. Joe DePasquale: The Art & Science of Creating JWST’s Images. Sarah Kendrew: Getting JWST Working. 31 Jan 2023, Guilford Hall Brewery, 1611 Guilford Ave, Baltimore, MD, 7:00 pm. Background of the poster is the JWST Pillars of Creation image.

ALT Three-part image showing the processing steps used to make the full-color image of the Pillars of Creation. The left panel is almost completely black. At center is a black-and-white image of the Pillars of Creation. The right panel is a full-color composite of the Pillars of Creation. The right panel has crisp layers of semi-opaque rusty red-colored gas and dust that starts at the bottom left and goes toward the top right. There are three prominent pillars rising toward the top right. The left pillar is the largest and widest. The peaks of the second and third pillars are set off in darker shades of brown and have red outlines. These details are mostly clear in the middle panel, but only appear in black and white.


ALT The Universe of Learning both at the American Astronomical Society meeting. A banner with the Universe of Learning logo sits on a table with various handouts. In the background is a TV showing a video about the Hubble Deep field.

ALT A bunch of buttons that say "Ask Me, I'm an Astronomer". The buttons have astronomical images on their backgrounds.

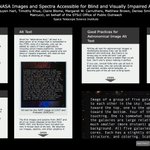
ALT Screenshot of an iPoster: "Making NASA Images and Spectra Accessible for Blind and Visually Impaired Audiences". The poster includes examples of our ongoing accessibility work including creating and using an in-house “alternative text” (alt-text) style guide to describe images, spectra, and other graphics in great detail. It also describes the translation of the HST Pillars of Creation and JWST Stephan’s Quintet images into tactile exhibits, and provides links for more information and examples.

ALT Groups of people engaged in conversations, sitting in a conference room.

ALT Selfie on a plane. I'm wearing a N95 mask and green glasses.

ALT The background of space is black, with few points of light. Stars have very short diffraction spikes. Galaxies and stars also appear in a range of colors, including blue, green, yellow, and red. The galaxies are less focused and more blobby.

ALT A collage of 3888 images of a wooded area taken over the course of a year, shot from the same spot. The images are cut into thin vertical strips and one strip per image is stitched together in the collage. This shows the progression of time from left to right: winter, spring, summer, fall, and then winter.

ALT Graph showing the average temperature (degrees celsius) for Montreal. Temperature in degrees celsius is on the y-axis. Values range from 30 to -20. Time, labeled in months, is on the x-axis. Lines showing the average high temperature and average low temperatures are plotted on the graph. The overall trend shows colder temperatures in January, rising gradually until it reaches a peak temperature in July, and then falling back down until December. The average high is -6 C and average low is -13 C in January. The high is 1 C and average low is -6 C in March. The high is 18 C and average low is 9 C in May. The high is 26 C and average low is 16 C in July. The high is 13 C and average low is 6 C in October. The high is -2 C and average low is -7 C in December.

ALT Graph showing the average temperature (degrees celsius) for Melbourne. Temperature in degrees celsius is on the y-axis. Values range from 30 to 5. Time, labeled as months, is on the x-axis. Lines showing the average high temperature and average low temperatures are plotted on the graph. The overall trend shows warmer temperatures in January, decreasing gradually until it reaches a low temperature in July, and then rising back up until December. The average high is 26 C and average low is 15 C in January. The high is 23 C and average low is 14 C in March. The high is 16 C and average low is 9 C in May. The high is 12 C and average low is 7 C in July. The high is 19 C and average low is 9 C in October. The high is 23 C and average low is 13 C in December.

ALT Graph showing the average temperature (degrees celsius) for Quito. Temperature in degrees celsius is on the y-axis. Values range from 20 to 6. Time, labeled as months, is on the x-axis. Lines showing the average high temperature and average low temperatures are plotted on the graph. The overall trend shows steady temperatures, with a slight bump in August and September. The average high is 16 C and average low is 9 C in January. The high is 16 C and average low is 9 C in March. The high is 17 C and average low is 9 C in May. The high is 18 C and average low is 8 C in July. The high is 19 C and average low is 9 C in September. The high is 17 C and average low is 10 C in October. The high is 16 C and average low is 9 C in December.