NO DMs/prn 🇺🇸 Former police/SWAT. Executive Protection Officer/armed
Jupiter,Fl USA, Mineral Bl,Ga
Joined April 2009
- Tweets726
- Following7.4K
- Followers2.4K
- Likes4.4K
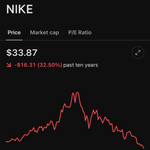



A volume spike in a small-cap stock can look like broad conviction when it’s really one large buyer.
Breakout volume is useful context, but participation matters too. Does demand keep showing up once that big order is filled?

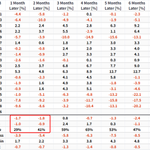
Stocks near highs while BBB/AAA credit spreads widen: this study shows weak average S&P 500 returns over the next 1–2 months.
Worth watching, but several signals cluster around the same episodes. Eighteen dates aren’t necessarily 18 independent warnings.

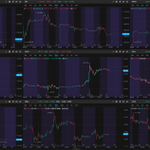
A 15-minute chart lineup makes relative strength easier to spot: which names hold a breakout, which build a base, and which give the move back.
The goal is to narrow the watchlist to a few clear setups. More charts don’t have to mean more trades.


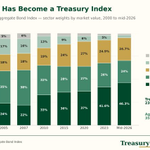
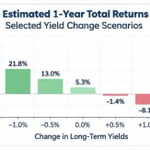
Same benchmark name, pretty different portfolio. Would be useful to see duration alongside those weights to understand how much the rate sensitivity has changed too.

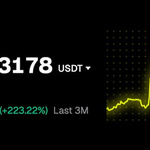
A screenshot showing a 223% gain in three months will get attention.
What I’d want to read is how it happened: starting capital, deposits, leverage and the worst drawdown. The useful part of a “how to get rich” story is whether the process holds up beyond the highlight reel.


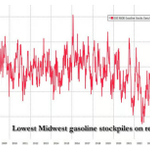
Midwest gasoline inventories hit a new low in the series shown here.
That leaves less of a cushion if refineries go offline or deliveries slow. Worth watching whether the next inventory reports show a rebuild—and how regional pump prices respond.

A seven-figure trading challenge is one way to settle an argument.
If this actually happens, show the full account history, position sizes and max drawdown alongside the returns. The scoreboard gets a lot more interesting when you can see the risk taken.
Germany’s export model is under pressure from both sides: US tech and AI, plus Chinese manufacturers competing in the products Germany built its reputation on.
The bigger concern in this chart is falling exports to China. Can German industry adapt fast enough?

Koz retweeted

🚨 $STX — TOSHIBA NEWS HITS HARD
STX is trading around $839.78 (-11.19%) after reports that Toshiba plans to double HDD capacity for AI data centers by FY2027. MarketWatch
Price action:
🟢 $790-$800 — Key support
🔵 $815-$823 — Recovery zone
🔥 $844-$850 — First resistance
🚀 $880-$900 — Major reclaim zone
My view:
Today’s drop is about future HDD supply and pricing power. The first sign of stabilization would be a clean reclaim of $850.
#STX #Seagate #AI #DataCenter #StockMarket

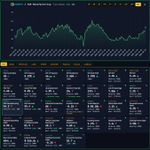
This UrbanKaoberg dashboard puts rates, inflation, jobs and growth in one place.
I like being able to compare the releases instead of reacting to each headline on its own.
The useful question: are the indicators telling a consistent story, or starting to pull apart?