

Stocks & Options Swing Trader.
USA
Joined December 2022
- Tweets10.6K
- Following50
- Followers464
- Likes873






Karam retweeted
WILLIAMS-SONOMA $WSM Q3’26 EARNINGS HIGHLIGHTS
🔹 Revenue: $1.99B (Est. $2.00B) 🔴; +5.8% YoY
🔹 Adj. EPS: $2.19 (Est. $2.19) 🟡; +12% YoY
🔹 Non-GAAP Gross Margin: 46.2% (Est. 45.78%) 🟢; +10 bps YoY
🔹 Comparable Brand Revenue: +5.1%
Affirms FY26 Guide:
🔹 Net Revenue Growth: +4.7% to +7.2%
🔹 Comps: +4.0% to +6.5%
🔹 Non-GAAP Operating Margin: 17.8% to 18.2%
🔹 Interest Income: ~$30M
🔹 Effective Tax Rate: 26%
Segment Net Revenue:
🔹 Pottery Barn: $762.7M
🔹 West Elm: $499.6M; +7% YoY
🔹 Williams Sonoma: $296.0M; +7% YoY
🔹 Pottery Barn Kids and Teen: $301.0M
Key Updates:
🔹 Tariff refund: $29.3M; $0.1M related interest income and $0.5M tariff-related adjustments. Substantially all of the $197.8M refund claim collected as of November 1, 2026.
🔹 Stockholder returns: $253M, including $163M in stock repurchases and $90M in dividends.
Comments:
🔸 “Every brand and channel delivered a positive comp. Our design advantages and direct sourcing model translate into superior economics, allowing us to increase full-price selling”

Karam retweeted
ALIBABA $BABA Q2’27 EARNINGS HIGHLIGHTS
🔹 Revenue: CN¥271.52B (Est. CN¥269.81B) 🟢; +10% YoY
🔹 Adj. EPS: CN¥8.10 (Est. CN¥11.16) 🔴; +86% YoY
🔹 Adj. EBITDA: CN¥46.06B (Est. CN¥40.57B) 🟢; +167% YoY
🔹 AI Cloud & Compute Services: CN¥60.97B; +53% YoY
Segment Revenue:
🔹 China E-commerce: CN¥98.50B; -5% YoY
🔹 China Quick Commerce: CN¥58.76B; +22% YoY
🔹 International E-commerce: CN¥25.72B; -8% YoY
🔹 Global Wholesale: CN¥14.26B; +6% YoY
🔹 AI Labs & Applications: CN¥4.44B; +51% YoY
🔹 All Others: CN¥27.71B; -5% YoY
Cash Flow:
🔹 Operating Cash Flow: CN¥15,690M; +55% YoY
🔹 FCF: -CN¥34.47B; -CN¥21.84B LY
🔹 CapEx: CN¥50,477M; +60% YoY
Key Updates:
🔹 Investment Gains: CN¥87.07B from investment disposals/revaluations, excluded from non-GAAP earnings.
🔹 Customer Management Revenue: -5% YoY. Excluding the new business development program's contra-revenue impact, +1% YoY. Relevant subsidies moved from sales and marketing expenses to contra revenue.
🔹 Cloud Growth: External recurring revenue +67% YoY, excluding compute equipment solutions. AI-related product revenue delivered triple-digit YoY growth for the thirteenth consecutive quarter.
🔹 Cash Investment: FCF outflow widened mainly on cloud infrastructure spending, partly offset by reduced instant-commerce losses and increased cloud customer prepayments.
Comments:
🔸 CFO: “we will maintain disciplined investments in AI capabilities with a focus on return on invested capital while targeting to achieve positive free cash flow.”

Karam retweeted
INTUIT $INTU Q1’27 EARNINGS HIGHLIGHTS
🔹 Revenue: $4.4B (Est. $4.31B) 🟢; +12% YoY
🔹 Adj. EPS: $2.91; +56% YoY
🔹 Global Business Solutions: $3.1B; +15% YoY
🔹 Online Ecosystem Revenue: $2.4B; +20% YoY
🔹 GAAP EPS: $2.59; +63% YoY
FY27 Guide:
🔹 Revenue: $23.08B-$23.37B (Est. $23.43B) 🔴
🔹 Adj. EPS: $22.88-$23.12
🔹 Adj. Operating Income: $8.06B-$8.15B
Q2 Guide:
🔹 Revenue: $4.93B-$4.95B (Est. $5.11B) 🔴
🔹 Adj. EPS: $3.17-$3.22
🔹 Adj. Operating Income: $1.13B-$1.15B
Other Q1 Metrics:
🔹 Consumer Revenue: $958M; +7% YoY
🔹 Credit Karma Revenue: $708M; +9% YoY
🔹 Mailchimp Revenue: $313M; -1% YoY
🔹 Stock Repurchases: $1.5B; +73% YoY
Key Updates:
🔹 Mailchimp Sale: Intuit agreed to sell Mailchimp to Bending Spoons for ~$3.68B, including $3.31B in cash and $368M in stock. It expects an early calendar 2027 close and plans to use the cash for buybacks.
🔹 Reporting & Outlook: Adjusted results now include stock-based compensation. Intuit recast the prior year on that basis. Both guides exclude the impact of the pending Mailchimp sale.
🔹 FY27 Outlook: Intuit updated revenue guidance for Credit Karma and reaffirmed its earnings outlook.
Comments:
🔸 CEO Sasan Goodarzi: “We delivered a solid first quarter, with results above the top end of our guidance”

Karam retweeted

$ANT - ANTHROPIC IPO TO BE RELEASED FOR QUOTATION AT 9:50AM ET
Karam retweeted
WALMART $WMT Q3’27 EARNINGS HIGHLIGHTS
🔹 Revenue: $188.84B (Est. $187.27B) 🟢; +5.2% YoY
🔹 Adj. EPS: $0.65 (Est. $0.64) 🟢; +5% YoY
🔹 Adj. Operating Income: $7.77B (Est. $7.54B) 🟢
🔹 Net Income (Walmart): $4.95B; -19.5% YoY
🔹 Global eCommerce: +17% YoY
Raises FY27 Guide:
🔹 Adj. EPS: $2.84-$2.89 (Est. $2.88) 🟡
🔹 Net Sales Growth (cc): +4.9% to +5.2%
🔹 Adj. Oper. Income Growth (cc): +8.0% to +8.6%
Segment Net Revenue:
🔹 Walmart U.S.: $125.0B; +3.6% YoY
🔹 Walmart International: $35.9B; +7.0% YoY
🔹 Sam’s Club U.S.: $25.9B; +10.0% YoY
Other Q3 Metrics:
🔹 Walmart U.S. Comp Sales (ex-fuel): +2.9%
🔹 Sam’s Club Comp Sales (ex-fuel): +4.9%
🔹 U.S. eCommerce: +23% YoY
🔹 Global Advertising: +25% YoY
🔹 Global Membership Fee Revenue: +17% YoY
🔹 Gross Profit Rate: +28 bps
Cash Flow (Nine Months):
🔹 Operating Cash Flow: $29.4B; up $2.0B YoY
🔹 Free Cash Flow: $6.8B; down $2.0B YoY
Key Updates:
🔹 Flipkart Timing: Big Billion Days cut Walmart International net sales growth by about 500 bps, with a corresponding benefit expected in Q4.
🔹 U.S. Holiday Season: Walmart’s main Black Friday event starts online Monday. Walmart+ members get early access to select deals.
🔹 Inventory: Global inventory rose 8.1%, reflecting seasonal event timing, strategic initiatives and cost inflation.
Comments:
🔸 CEO John Furner: “We delivered strong results, growing our core business and gaining market share.”

Karam retweeted
EVERPURE $P Q3’27 EARNINGS HIGHLIGHTS
🔹 Revenue: $1.5B (Est. $1.33B) 🟢; +51% YoY
🔹 Adj. EPS: $0.86 (Est. $0.78) 🟢; +48% YoY
🔹 Non-GAAP Gross Margin: 69.2% (Est. 70.01%) 🔴; -490 bps YoY
🔹 Non-GAAP Oper Income: $345M (Est. $274M) 🟢; 23.6% margin
🔹 Subscription ARR: $2.2B; +20% YoY
🔹 RPO: $4.2B; +44% YoY
🔹 Product Revenue: $948M; +77% YoY
🔹 Subscription Services Revenue: $512M; +19% YoY
Raises FY27 Guide:
🔹 Revenue: $5.20B-$5.21B (Est. $5.05B) 🟢; from $5.03B-$5.07B
🔹 Non-GAAP Oper Income: $1.08B-$1.09B (Est. $965M) 🟢; from $940M-$960M
🔹 Revenue YoY Growth Rate: 42%
🔹 Non-GAAP Oper Income YoY Growth Rate: 71%-72%
Q4 Guide:
🔹 Revenue: $1.50B-$1.52B (Est. $1.49B) 🟢
🔹 Non-GAAP Oper Income: $350M-$360M (Est. $301M) 🟢
🔹 Revenue YoY Growth Rate: 42%-43%
🔹 Non-GAAP Oper Income YoY Growth Rate: 55%-60%
Key Updates:
🔹 Secured a design win with a second top-five hyperscaler.
🔹 Repurchased 0.5 million shares for approximately $67 million.
Comments:
🔸 “We are raising full-year guidance for the third consecutive quarter and reiterating our strong preliminary FY28 outlook, underscoring confidence in our durable business model and broad-based momentum.”

Karam retweeted
PALO ALTO NETWORKS $PANW Q1’27 EARNINGS HIGHLIGHTS
🔹 Revenue: $3.44B (Est. $3.31B) 🟢; +39% YoY
🔹 Adj. EPS: $1.05 (Est. $0.97) 🟢; +13% YoY
🔹 NGS ARR: $9.73B; +66% YoY
Raises FY27 Guide:
🔹 Revenue: $14.52B-$14.57B (Est. $14.16B) 🟢
🔹 Adj. EPS: $4.26-$4.30 (Est. $4.18) 🟢
🔹 NGS ARR: $11.48B-$11.53B; +26% to +27% YoY
🔹 Non-GAAP Operating Margin: 29.5%
🔹 Adjusted Free Cash Flow Margin: 38.0%
Q2 Guide:
🔹 Revenue: $3.53B-$3.55B (Est. $3.42B) 🟢
🔹 Adj. EPS: $1.01-$1.03 (Est. $1.01) 🟡
🔹 NGS ARR: $10.20B-$10.22B; +61% YoY
Key Updates:
🔹 Intent to Acquire Applied Compute, a leading platform for post-training and inference of open-weight AI models
Comments:
🔸 “Given the current threat environment and demand we see ahead of us, we are materially raising our full year guidance.”

Karam retweeted
MARKET MOVERS
🔴 DOWNGRADES
- $NVDA: Downgraded to Hold by Summit Insights
📉 PRICE TARGET CUT
$NVDA: PT cut to $260 from $267 by Morgan Stanley
$NVDA: PT cut to $250 from $300 by Wells Fargo
$NVDA: PT cut to $230 from $300 by Piper Sandler
$NVDA: PT cut to $250 from $300 by Jefferies
$NVDA: PT cut to $220 from $240 by UBS
🔵 RATING REITERATIONS
$NVDA: Buy reiterated by Goldman Sachs; PT $220
$NVDA: Buy reiterated by Citi; PT $225
$NVDA: Overweight reiterated by Cantor Fitzgerald; PT $250
$NVDA: Buy reiterated by BofA Securities; PT $280
$NVDA: Sector Weight reiterated by KeyBanc; PT removed
$NVDA: Overweight reiterated by Barclays; PT $210
$NVDA: Hold reiterated by Aletheia Capital; PT removed
$NVDA: Hold reiterated by Melius; PT $185
$NVDA: Buy reiterated by Stifel; PT $205
$NVDA: Hold reiterated by HSBC; PT $170
Karam retweeted
NVIDIA $NVDA Q3’27 EARNINGS HIGHLIGHTS
🔹 Revenue: $115.8B (Est. $109.3B) 🟢; +103% YoY
🔹 Adj. EPS: $2.68 (Est. $2.47) 🟢; +111% YoY
🔹 Data Center: $107.6B (Est. $101.9B) 🟢; +110% YoY
🔹 Adj Gross Margin: 74.9% (Est. 74%) 🟢; +140 bps YoY
Q4 Guide:
🔹 Revenue: $130.0B +/- 3% (Est. $124.4B) 🟢
🔹 Adj Gross Margin: 71.0%-72.0% (Est. 71.7%) 🟡
🔹 Adj OpEx: ~$10.7B
Segment Revenue:
🔹 Edge Computing: $8.2B (Est. $7.5B) 🟢; +42% YoY
Capital Return:
🔹 Shareholder Returns: $28.1B in Q3
🔹 Buyback Authorization: Increased by $150B; no expiration
🔹 Remaining Authorization: ~$227.3B
Key Updates:
🔹 FY27 GAAP & Non-GAAP Tax Rate: 16%-18%; excludes discrete items and material tax-environment changes
Announcements:
🔹 Vera Rubin NVL72: Shipped; fastest product ramp in company history
Comments:
🔸 “Vera Rubin is off to an explosive start, our roadmap is on track and our ambition has never been greater.”

Karam retweeted

#earnings for the week of November 16, 2026
earningswhispers.com/calweek
$NVDA $XPEV $PDD $WMT $INFQ $BABA $HD $PANW $TGT $KLAR $JD $ROST $BIDU $RCAT $DIS $GAP $P $LOW $TJX $IIIV $GLBE $HTHT $FUTU $NTIC $ACM $LZB $BBWI $BJ $AS $VIK $TCEHY $TME $OPRA $TSN $ZIM $JOYY $LQDT $OMER $SQM $SR $MATW $MNTK $WSM $BSP $ESTC $INTU $KEYS $ENR $ESE $BEKE

ALT The most anticipated earnings releases for the week of November 16, 2026, are NVIDIA #NVDA, XPeng #XPEV, PDD Holdings #PDD, Walmart #WMT, Infleqtion #INFQ, Alibaba Group #BABA, Home Depot #HD, Palo Alto Networks #PANW, Target #TGT, and Klarna Group #KLAR.
Karam retweeted
FORGENT $FPS Q1’27 EARNINGS HIGHLIGHTS
🔹 Revenue: $479M (Est. $462M) 🟢; +69% YoY
🔹 Adj. EPS: $0.24 (Est. $0.20) 🟢
🔹 Adj. EBITDA: $105M (Est. $97.8M) 🟢; +61% YoY
🔹 Adj. Net Income: $72.0M (Est. $61.8M) 🟢
Raises FY27 Guide:
🔹 Revenue: $2.45B-$2.65B (Est. $2.55B) 🟡; from $2.4B-$2.6B
🔹 Adj. EBITDA: $587M-$637M (Est. $606M) 🟡; from $575M-$625M
🔹 Adj. EPS: $1.30-$1.44 (Est. $1.35) 🟡; from $1.26-$1.40
Other Q1 Metrics:
🔹 Net Income: $55M; +252% YoY
🔹 Net Income Margin: 11.5%; +600 bps YoY
🔹 Cash Flow from Operations: $136M
Announcements:
🔹 Manufacturing Capacity: Much of new capacity now online
🔹 Backlog: Fully covers FY27 guidance
Comments:
🔸 “we are raising our full-year outlook”
🔸 “Robust customer demand and strong execution on our production ramp give us greater confidence in our higher outlook.”

Karam retweeted
COREWEAVE $CRWV Q3’26 EARNINGS HIGHLIGHTS
🔹 Revenue: $3.66B (Est. $3.55B) 🟢; +168% YoY
🔹 Adj. Operating Income: $379M (Est. $234M) 🟢
🔹 Adj. EBITDA: $2.26B (Est. $2.04B) 🟢; +169% YoY
🔹 Adj. Net Loss: -$529M (Est. -$677M) 🟢
🔹 GAAP EPS: -$1.27
Raises FY26 Guide:
🔹 Revenue: $13.0B-$13.3B
🔹 Adj. Operating Income: $1.3B-$1.4B
🔹 CapEx: $37B-$39B; from $35B-$39B
🔹 Active Power: >1.85 GW
🔹 Run-Rate Revenue: $20B-$21B
Other Q3 Metrics:
🔹 Revenue Backlog: ~$132.5B
🔹 Active Power: >1.7 GW; +200 MW added
🔹 Contracted Power: >4.6 GW; +900 MW added
🔹 International Power: >1.3 GW
Announcements:
🔹 CoreWeave Forge: AI development environment launched
🔹 Vera Rubin NVL72: 4.8x greater token throughput
🔹 Convertible Notes: ~$4.2B raised
🔹 DDTL 5.5 Facility: $2.6B closed
Comments:
🔸 “This was a breakout quarter for CoreWeave, with revenue increasing by more than $1 billion sequentially and adjusted operating margins reaching double digits a quarter ahead of plan.”
🔸 “approximately $9 billion in customer prepayments and deposits expected in the next three months alone.”

Karam retweeted
CONSTELLATION ENERGY $CEG Q3’26 EARNINGS HIGHLIGHTS
🔹 Revenue: $9.55B (Est. $9.37B) 🟢; +45% YoY
🔹 Adj. EPS: $5.06 (Est. $3.85) 🟢; +66% YoY
🔹 GAAP EPS: $5.19; +75% YoY
🔹 Nuclear Capacity Factor: 97.2%; +40 bps YoY
Raises FY26 Guide:
🔹 Adj. EPS: $12.50-$12.80 (Est. $12.15) 🟢
Announcements:
🔹 Rhode Island State Energy Center: acquiring for $715M; 609 MW
🔹 Amazon: 20-year, 690 MW PPA
🔹 Calvert Cliffs: more than $3B investment; 190 MW expansion
🔹 Google: 20-year PPA; more than $4.3B investment across 11 units; ~890 MW capacity
🔹 Google: 15-year load-following agreement for 2,700 MW in PJM
🔹 Peak+: 20-year, 270 MW agreement beginning in 2028
🔹 DOE: Up to $5B loan guarantee supporting nuclear uprates; 30-year term
Key Updates:
🔹 Unrealized (Gain) Loss on Fair Value: -$127M, -$0.36/share; a gain in GAAP EPS, excluded from Adj. EPS
🔹 Q3 Adj. EPS Drivers: favorable market and portfolio conditions, addition of Calpine; offset by interest, nuclear PTC
Comments:
🔸 “These agreements add more than 1,000 megawatts of new, emissions-free generation to the grid and help ensure the continued operations of existing clean power for generations to come.”
🔸 “This strong performance allowed us to raise the midpoint of our adjusted operating earnings guidance range for the second time this year.”

Karam retweeted
I doubt Jensen Huang will be able to remain as $NVDA CEO. This could put short-term pressure on the stock of the second most valuable company in the world. He has no natural successor within the company. While Huang has not committed any crime or tort, his code of conduct and judgment will be called into question which will likely result in his removal by the NVDA Board. While I don’t see long-term value impairment, many portfolio managers will reduce their $NVDA holdings in the coming weeks as a result of uncertainty over who could succeed Jensen as NVDA CEO.
The company’s board said in a statement Sunday it has no reason to believe either the company’s secrets or national security were compromised and expressed confidence in the CEO’s leadership. A committee of independent directors helped by outside counsel would oversee the probe, the board said, and the “inquiry will examine all available information.”
“Today’s news will not slow NVIDIA. Jensen is committed to continuing to lead NVIDIA as CEO without interruption,” an Nvidia spokesman said in a statement.
Jensen Huang’s Email to Company - Sunday 11/8/2026:
Subject: A message
I owe my family and all of you an apology.
I was unfaithful to my wife. My actions hurt her and our children. There is no excuse for what I did. I am deeply sorry.
Throughout my life, my family has given me love and support. They deserve my honesty and loyalty. Instead, I let them down and damaged the life we built together. I take full responsibility for what I did and the hurt I caused, and I accept the criticism that comes with it.
To my wife and family: I love you. I know an apology cannot undo what I have done. I hope our family will heal and that, over time, I can earn back your trust.
To my colleagues at Nvidia, including those I have worked alongside for decades, our board, partners, and shareholders around the world: you deserve better from me. Leading Nvidia is the privilege of my life. My responsibility is to serve you and be worthy of your trust. I have fallen short of that responsibility. I am fully committed to Nvidia and will work to earn back your confidence.
Regarding the national security concerns raised in news reports, NVIDIA’s Board of Directors has initiated an independent investigation. I support the investigation and will cooperate fully. I love our country and our company, and I am committed to protecting NVIDIA and supporting America’s national security. I am proud and grateful to be an American.
My family bears no responsibility for my choices. I do. Please give them privacy.
Karam retweeted
SUPERMICRO $SMCI Q1’27 EARNINGS HIGHLIGHTS
🔹 Revenue: $19.9B; +298% YoY
🔹 Adj. EPS: $1.81 (Est. $1.62) 🟢; +417% YoY
FY27 Guide:
🔹 Revenue: $72.0B-$82.0B (Est. $69.17B) 🟢
Q2 Guide:
🔹 Revenue: $19.5B-$21.5B
🔹 GAAP EPS: $1.59-$1.83
🔹 Adj. EPS: $1.66-$1.90
Other Q1 Metrics:
🔹 Gross Margin: 12.7% GAAP; 12.8% Non-GAAP
🔹 Adjusted EBITDA: $2.2B
🔹 Cash Flow Used in Operations: $434M
🔹 Cash & Equivalents: $6.9B
Comments:
🔸 “Supermicro’s transformation into a Total AI and IT Datacenter Solution provider continues to accelerate, delivering record revenue of $19.9 billion for the first quarter fiscal 2027,” said Charles Liang, Founder, President, and CEO of Supermicro.
🔸 “DCBBS is driving significant value for our customers—from gigawatt-scale datacenters down to single-container PODs—which, including our expanding software, proactive service, and networking solutions, is enhancing profitability and long-term shareholder value.”

Karam retweeted
CIPHER DIGITAL $CIFR Q3’26 EARNINGS HIGHLIGHTS
🔹 Revenue: $26.7M (Est. $38.5M) 🔴; -63% YoY
🔹 EPS: -$0.22 (Est. -$0.26) 🟢
🔹 Adj. EBITDA: -$10M
Operations:
🔹 HPC Lease Revenue: $5.9M; first recognized
🔹 ERCOT: 1 GW base load; 1.6 GW studied load
🔹 Pipeline: 5.9 GW; up to 2.5 GW generation
🔹 Horizon: 70 MW; energization expected in 2029
Key Updates:
🔹 Barber Lake: 20-year lease; ~$9.1B contracted revenue
🔹 Notes: $165.9M equitized; over 90% retired
Comments:
🔸 “Cipher was built for this market, and this quarter we took important steps to strengthen our position for the long term,”

Karam retweeted
$MRVL TO ACQUIRE $LITE IN $115B ALL-STOCK DEAL
Marvell has agreed to acquire Lumentum in an all-stock transaction valued at approximately $115B in enterprise value, combining two major suppliers of AI infrastructure and optical networking technology.
Under the agreement:
• Lumentum shareholders will receive 4.5 Marvell shares for each LITE share, implying roughly $1,132 per share.
• The offer represents a 23.9% premium to unaffected closing prices on October 28.
• Marvell shareholders will own approximately 67% of the combined company, with Lumentum shareholders holding 33%.
The deal brings together Marvell's custom AI chips, networking switches and interconnect technology with Lumentum's lasers, optical transceivers and optical circuit switching capabilities.
The bigger opportunity is the growing shift from copper to optical connectivity as AI data centers require faster data transfer, greater bandwidth and improved power efficiency.
Marvell says the combination could expand its addressable market to $550B, allowing it to offer more integrated connectivity solutions across AI data centers and within advanced chip packages.
The companies also expect:
• More than $1B in annual run-rate cost synergies.
• Improved long-term revenue growth and profit margins.
• Accretion to Marvell's adjusted EPS in the first year after closing.
Matt Murphy will remain CEO of the combined company, with the transaction expected to close in H1 2028, subject to shareholder and regulatory approvals.
Separately, Marvell reaffirmed the midpoint of its fiscal Q3 revenue guidance while narrowing the expected range to ±2% from ±5%.


Karam retweeted

Major Indian online investment platforms are unlocking access to U.S. stocks for millions of retail investors eager to diversify into global assets as the country’s markets continue to underperform
Karam retweeted
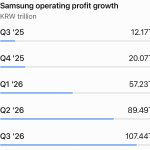
Kioxia, a major Japanese NAND flash memory maker and $SNDK's longtime manufacturing joint-venture partner, issued its Q3 (Oct–Dec) outlook:
🔹 Revenue: $15.9B (Est. $18.6B) 🔴; +1% QoQ
🔹 Oper Profit: $12.7B (Est. $14.9B) 🔴
🔹 Net Profit: $8.6B (Est. $10.2B) 🔴
🔹 EPS: $5.41 (Est. $6.65) 🔴
🔹 9M: Oper Profit $33.4B / Net Profit $22.6B
🔸 Sees Q3 at about the Q2 level: data-center demand stays strong, but a stronger yen weighs (assumes ¥157/$ vs ¥161 in Q2)
Karam retweeted
INTEL $INTC Q3’26 EARNINGS HIGHLIGHTS
🔹 Revenue: $16.5B (Est. $16.5B) 🟡; +21% YoY
🔹 Adj. EPS: $0.52 (Est. $0.40) 🟢; +126% YoY
🔹 GAAP EPS: $0.60
🔹 Non-GAAP GM: 44.1% (Est. 42.1%) 🟢; +410 bps YoY
🔹 Gross CapEx: $4.2B; -43% YoY
Q4 Guide:
🔹 Revenue: $15.0B-$16.0B (Est. $17.1B) 🔴
🔹 Non-GAAP EPS: $0.25 (Est. $0.43) 🔴
🔹 Non-GAAP GM: 38.0% (Est. 42.4%) 🔴
🔹 GAAP EPS: $0.10
Segment Revenue:
🔹 CCPG: $8.1B; -5% YoY
🔹 DCAI: $7.30B (Est. $6.46B) 🟢; +78% YoY
🔹 Intel Foundry: $6.7B; +58% YoY
🔹 All Other: $0.7B; -30% YoY
🔹 Total Intel Products: $15.4B; +22% YoY
Other Q3 Metrics:
🔹 Operating Cash Flow: $5.1B (Est. $4.9B) 🟢
🔹 Non-GAAP Oper Margin: 19.6%; +8.4 ppts YoY
🔹 Adj. Free Cash Flow: $1.6B
Key Updates:
🔹 Escrowed Shares: $120M mark-to-market gain; +$0.17 EPS
🔹 Public Equity Offering: $23B completed
🔹 Intel 14A: 0.9 process design kit released in October
Comments:
🔸 “Revenue, gross margin and earnings per share exceeded guidance, including our strongest data center revenue growth in 15 years.”
🔸 “Looking ahead, we see the PC slowdown continuing at least through the first half of next year, but we remain optimistic about the opportunities across our broader portfolio, and we will continue making disciplined investments in capacity and working capital to increase supply and support future growth.”
