

Former BLK analyst. Perpetual learner. 0dte SPX expert. Sharing options flow, charts, & trades. Founder @nightglasstrade
San Francisco
Joined April 2025
- Tweets12.8K
- Following118
- Followers7.7K
- Likes7.5K





Pinned Tweet
When I first started trading off options flow, I never knew what to actually pay attention to.
Every platform showed me the same thing: thousands of trades, and I had no way to tell which ones were real bets.
Most traders who use flow run into the same wall. So I spent the last year building something that filters this out first, then tells you what to do with what's left.
Instead of 250k options flow alerts a day, Nightglass gives you 50-75.
Instead of guessing which alerts hold up, Nightglass grades every one in public.
Instead of guessing where to enter or exit, Nightglass gives you the trade plan.
Introducing Nightglass — it cuts the 98% of flow that's noise and shows you the 2% worth noticing.
It's available now.

Introducing Nightglass — the options flow platform built to filter out the noise and show you the 2% of trades worth noticing.
Hedge funds and institutions place bets through options every day, and their trades are public. You just have to know how to spot them.
The problem: 98% of options flow is noise. That's why we built Nightglass — it doesn't show you more flow, it shows you less. Then it gives you the plan to trade it.
-Institutional support and resistance levels on any US-listed stock
-Real-time flow alerts
-Pre-market report of the prior session's institutional positioning
-Live SPX gamma exposure levels
-Earnings setups with defined trade structures
-A morning brief before every open with key news, sell side research, top flows, and more.
Live today.
$WGMI
The left-for-dead bitcoin miners, now mostly AI datacenter landlords, got flushed yesterday on the hot CPI print. $WGMI -11%, down 56% from its June high.
The selling came on huge volume:
$CRWV -16% on its heaviest volume day of 2026 (111M shares, ~4x normal)
$CIFR posted its two heaviest volume days of the year back to back
$WULF -13% on 2x normal volume
Into the lows, Nightglass flow caught buyers stepping in:
$WULF bought 25,762 Jan '27 $13 calls ($5.7M) Monday, then bought 24,000 Mar '27 $15/$25 call spreads at 3pm Tuesday, near the low
$RIOT bought 19,499 Jan '27 $16 calls ($5.3M), then sold 97,600 Dec $10 puts on the drop, a bet it holds $10
$CIFR bought 25,187 Jan '27 $11 calls ($5.7M) the day it fell 13%
$CRWV sold 23,547 Jan '27 $60/$50 put spreads, collecting $7.5M, a bet it holds $56.80 into January
All new positions.
$WGMI's line is the March low at $31.79.

$HUT already up 4% off this level? Nice


KASM retweeted
$SPX 7685 dip buy level was offered pre market -- all it cost was a follow

$SPX levels for Monday
Chips just had their longest losing streak since 2008, and SPX is bouncing about 40 points premarket to 7,700. That lands right on the call wall (7,700-7,705), with the 50-day at 7,706 sitting on the same spot.
It's a weak wall. Gamma is positive at every strike from 7,700 up to 7,800, but no single strike dominates. A push through grinds higher instead of stalling. The first real resistance is 7,739-7,740, where the 20-day, 8-day and 13-day all sit.
The flip is 7,680, and the strikes from 7,675 to 7,695 keep switching sign. Under that, the 7,650 put wall is four times bigger than any other strike, with negative gamma all the way down to 7,500. Lose the flip and there's not much to stop a move into 7,650.
The trade: long on a dip into 7,685, the last positive strike above the flip, with prior demand at 7,681 just under it. Targets 7,706, then 7,719. Buying the open on the wall chases the whole gap. A hold under 7,676 ends it.
Range 7,650-7,740.
Above 7,747 opens 7,763 / 7,779.
Below 7,648 opens 7,631 / 7,616.
Meta, Tesla and IBM report Wednesday.

KASM retweeted
$SPX 7685 shared in our pre-market note to members.


$SPX levels for Monday
Chips just had their longest losing streak since 2008, and SPX is bouncing about 40 points premarket to 7,700. That lands right on the call wall (7,700-7,705), with the 50-day at 7,706 sitting on the same spot.
It's a weak wall. Gamma is positive at every strike from 7,700 up to 7,800, but no single strike dominates. A push through grinds higher instead of stalling. The first real resistance is 7,739-7,740, where the 20-day, 8-day and 13-day all sit.
The flip is 7,680, and the strikes from 7,675 to 7,695 keep switching sign. Under that, the 7,650 put wall is four times bigger than any other strike, with negative gamma all the way down to 7,500. Lose the flip and there's not much to stop a move into 7,650.
The trade: long on a dip into 7,685, the last positive strike above the flip, with prior demand at 7,681 just under it. Targets 7,706, then 7,719. Buying the open on the wall chases the whole gap. A hold under 7,676 ends it.
Range 7,650-7,740.
Above 7,747 opens 7,763 / 7,779.
Below 7,648 opens 7,631 / 7,616.
Meta, Tesla and IBM report Wednesday.
KASM retweeted

As of now looks like I should’ve pulled the trigger on this trade. I’m a big fan of these more exaggerated mean reversion trades such as this.
However, for many they are easy to get wrong and cause damage due to over participation and mis timing the trade.
They are rarely easy but often fast and lucrative.
Since we are gapping up notably I wanted to share this graphic from Brian Shannon. Potentially in play tomorrow, although I have some doubts about its follow through ability.
We shall see!


Was flip flopping on starting an $SOXL position into the weekend, think we have a super reasonable opp here with SMH down 9 days in a row and two full sessions outside the Bollinger band. 7% below the 9EMA here. Looking around further decided to wait for next week if it presents itself.
This is a reversion play that is really one of my favorites in my playbook. But it is challenging one to get right!
There is no doubt that the past eh 6-7 sessions the landscape changed. It has been there for a bit of time that the landscape has changed. I have made some adjustments certainly myself but always sticking to what i know and what I can execute properly.
The three dials that trader's turn in terms of enviornment are these
-Sizing
-Duration
-Frequency
So, only holding my dearly beloved Shopify rn waiting to see what next week brings.
Trading is hard so make sure you navigate properly and know your setups and when they are presenting and when they aren't!

Tomorrow won't be Black Monday. But beyond the clickbait, there are real cracks in the market's armor you should be paying attention to. Here's why I think people should be cautious heading into November.
Today looks a lot like February, right before the market dropped about 10% in a month.
What happened back then?
Starting in early January, money rotated out of tech into defensive stocks. By late February consumer staples were up 17% and software down 23%, yet the S&P went nowhere.
Underneath, breadth was deteriorating: the share of stocks above their 50-day average slid from 73% to 53%.
Then the index gave way. Within about a month $SPX was 9% below its record and $QQQ was down 12%. Staples, the "safe" trade, fell 9% too.
Now compare that to today:
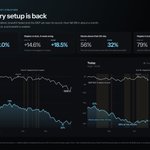
Breadth has been sliding since mid-August. The S&P's Oct 6 record came with only 30% of stocks above their 50-day, the thinnest record in our data back to 2022. January's record had 66%.
The rotation is back. Staples just had their best two weeks in five years, up 8.8%. The previous best was Feb 12 of this year, three weeks before the index broke.
The @nightglasstrade Market Structure scan shows the same flip. On the Feb 27 close, 79% of staples had bullish structure vs 37% of tech. Friday: 80% vs 34%. Ten days earlier, at the record, it was the reverse.
And the index is starting to crack: $SPY 2% off its record, $QQQ down 6.6%, semis down 15% in two weeks.
A February-sized drop from the record would put $SPY near $708. History doesn't repeat on schedule, so I'm watching for the following support levels:
$SPX 7630 (Aug 4th gap open)
$SPX 7600 (100-day SMA)
$SPX 7563 (21-week EMA)
$SPX 7511 (Sept low)

$QQQ just fell 5.5% in a week.
Were there signs the market was becoming more defensive?
Look beneath the index, and signs of this weakness started showing up over a week ago.
How?
Sector rotations.
They happen as investors reassess growth, valuations and risk. When confidence fades, businesses with steadier demand—like consumer staples and utilities—can become more attractive.
That shift can show up in how many stocks are strengthening or weakening within each sector.
Here’s what Nightglass’s Market Structure data showed from October 12–16:
• Technology: 49% → 34% in bullish structure
• Consumer Defensive: 62% → 80%
• Utilities: 56% → 71%
Fewer tech stocks held bullish structure. More defensive stocks gained it.
By Friday, 80% of consumer defensive names were bullish, compared with just 42% across the full scan.
That divergence is consistent with a defensive rotation.
Watching those changes gives you context for the selloff as it develops—and helps you identify where strength is building while former leaders weaken.


KASM retweeted

The best free market resource you'll see all week is back. Issue 009 is out now.
Our Weekly Flow Map — a clear view of institutional positioning, key options levels, and the market dynamics shaping the week ahead.
Notable flow: $RIOT Jan '27 16 calls bought to open, ~$5.3M on Tuesday (~19,500 new OI), even as the stock fell 19% on the week.
Focus list: $STGW $XLU $ROST $STLD $OXY — five charts holding bullish structure, each with printed support, targets, and the exact line where the read stops working.
Read this week's report: nightglass.trade/map/2026-10…


GEX this, VEX that. Nothing beats old school supply and demand.
@nightglasstrade has perfected this concept and provides accurate levels for all US listed stocks and ETFs.
This trade alone would have generated over 50% return in 10 minutes trading 0dte $SPY


