

JP+ College Football Power Ratings I Beating the Market One Efficiency Edge at a Time I Process Over Resume I #IUFB
New York
Joined May 2009
- Tweets1.1K
- Following580
- Followers1.7K
- Likes212




Oregon State: Officially a Wagon
Don’t be a coward, anoint them @TomFornelli @Chip_Patterson @Cover3Podcast

JP+ Conference Power Ratings (Through Wk7)
Oregon State, the best team in the new Pac-12, is above 36 of the 67 Power 4 teams, more than half the P4
No team from the SEC, Big Ten or Big 12 ranks in the bottom 40. The SEC's lowest-rated team is #54 (Arkansas), the Big Ten's is #76 (Maryland) and the Big 12's is #95 (WVU)
The SEC has 12 of the top 25 teams, and all 16 SEC teams are above average
15 of 17 ACC teams rate below Oregon State; only Miami and Louisville rate higher. The ACC's median team is #61 (Clemson)

JP+ retweeted

2026 Wk 9 #MetricsConsensus
Ohio State jumps from #4 to #1.
Alabama falls from #3 to #5.
Indiana stays at #6.
And BYU falls (!) one spot from #13 to #14, b/c of action behind them (Tennessee & Mississippi).

JP+ Week 8 Mid-Week Board
No official model picks but posting for line reference.
Full board always available here: jpplusratings.com/games/


JP+ retweeted
David, how about a contest. You pick the final point differential of all Kentucky games b/w now and the EOY, and JP's model does the same.
Graded by SUP winner, ATS winner, & how close the point differential were.
Do you think you could beat it? Or would JP's model likely win?
Did the better team win? Did they win by as much as the score says?
Week 7 had one of each miss:
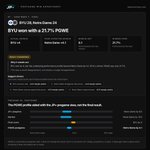
🔹 BYU beat Notre Dame with a 21.7% postgame win expectancy
🔹 Ole Miss won by 28 when the play profile said 14.8
jpplusratings.com/games/revi…


JP+ retweeted

Me and @JPPlusCFB trying to explain models to the public.

Today’s discourse explained exactly why sportsbooks print money. Most people can’t tell you what a power rating is, how to build one, or why it says what it says. They see a 6-1 team rated below a 4-3 team and lose their minds over “but they WON.” Wins are the result. Efficiency is the process. The books are happy to keep taking money from people who can’t tell the difference.
I expected better out of big blue nation, may have to downgrade the state of Kentucky in my 50 state power rating....kidding, maybe
JP+ retweeted
JP+ Resume vs Power Rating
Been getting some good dialogue on this so thought would clear it up
JP+ has two rankings, and they answer different questions:
Power Ratings: how good is this team? They’re built from play-by-play efficiency, and wins and losses don’t count directly. Use them to predict the next game.
Resume: what has this team earned? Every game is graded on the result, the opponent and the venue, compared with what an elite team would have done against the same schedule. Use it to pick a playoff field.
Kentucky shows the difference. At 6-1, with wins over LSU/Oklahoma/Texas A&M, they’re #3 in Resume because they’ve banked real wins. They’re #29 in Power Ratings because, play by play, they haven’t looked like a top-10 team.
Both are true. Kentucky has earned a seat at the table, but the model wouldn’t favor them against most of the teams they’re sitting with.
JP+ retweeted
2026 Wk 8 : MAE
5 models beat Circa in MAE, lead by @masseyratings, which posted an excellent 10.68 w/ just 13.19 RSE.
Other models to beat the Circa open in MAE were power ratings from @ActionNetworkHQ via @Collin1, @OddsTrader_, public numbers from @thepowerrank & @JPPlusCFB.

JP+ retweeted
2026 YTD thru Wk 8 : ATS
Our top ATS performer continues to be SP+ from @ESPN_BillC, which has gone 53.9% vs Circa closing lines.
Others above the 52.4% break-even are @SportsLine, @JPPlusCFB, @Unive_FootBall and PiRate. JP+ is the only one in this top group w/ wATS > ATS.

JP+ Resume vs Power Rating
Been getting some good dialogue on this so thought would clear it up
JP+ has two rankings, and they answer different questions:
Power Ratings: how good is this team? They’re built from play-by-play efficiency, and wins and losses don’t count directly. Use them to predict the next game.
Resume: what has this team earned? Every game is graded on the result, the opponent and the venue, compared with what an elite team would have done against the same schedule. Use it to pick a playoff field.
Kentucky shows the difference. At 6-1, with wins over LSU/Oklahoma/Texas A&M, they’re #3 in Resume because they’ve banked real wins. They’re #29 in Power Ratings because, play by play, they haven’t looked like a top-10 team.
Both are true. Kentucky has earned a seat at the table, but the model wouldn’t favor them against most of the teams they’re sitting with.