




Pinned Tweet
Opendoor 2.0: The Singularity Scaler Nobody Is Pricing In
A road to a $1000 per share.
$OPEN is sitting at $4.42.
EBITDA profitable ahead of schedule. 5,000+ acquisition contracts in Q1 — best since 2022.
LTM free cash flow: +$519M. Was -$6.3B in 2021.
The market is still pricing it as a broken iBuyer.
It's becoming a housing OS.
Full breakdown 🧵

It’s gonna be an absolutely ruthless rebound for $OPEN when yields drop 📉
Days to cover climbed from 9.97 to 10.67.
At this point it’s not if but when…


Bought more $ZETA today. Not a major holding but it’s a quality company that truly understands how to apply AI to business impact.
New WS price targets come in at $45-55… what a change of events for the company, dipping in the mid 10s early this year.
$OPEN holders have unmatched endurance
Opendoor is truly in a wild place:
the 10Y yield that is tearing down $OPEN stock price while management is executing better and reshaping the business. However the market doesn’t reward it.
$OPEN is no longer a meme stock.
It's a mortgage rate with a ticker.
Mortgage rates just broke 7% for the first time since January 2025. The 10-year Treasury hit a 19-year high.
Despite this pressure on the stock price, the reversal can be even more dramatic.
I ran 1,461 days of data. The 30-year Treasury, the one on every chart, is the weakest signal of the lot. The mortgage rate explains about 90% of where OPEN has traded since May.
That's the bad news.
What should make every bear nervous is that the same math runs in reverse.
I built a formula that prices OPEN at every mortgage rate from 7.50% down to 6.00%. There's a rate where it roughly doubles from here.
But right now, OPEN is trading about 16% above where rates say it should be.
Either the market knows something the rates don't, or the stock is about to catch down. Historically, half of a gap like that closes in about four trading days.
Meanwhile, Opendoor is quietly selling 6.5% mortgages in a 7% market. It's not free, and I show what it really costs them.
Full breakdown below.

If AI models receive access to proprietary data, a company is giving its edge away and commoditisation of knowledge begins.

$ABCL its price movement gives me $HOOD vibes.
Check out the similarities between $ABCL today on the monthly chart and where $HOOD was in 2024.
Both breakouts were violent, with strong support on their key trendlines: the SMA20 and EMA20 1 month. Both tested them again, a panic hammer under it, and then ripped off.
Missed $HOOD back then, but now in both. 3x on shares in $ABCL so far.


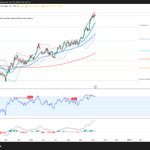
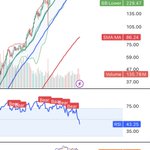
Look at the negative divergence starting to appear on the US10Y and positive divergence at $OPEN.
Writings are on the wall. At least short term we may see a relief coming soon as buying power on the 10Y starts to fade.


Opendoor is truly in a wild place:
the 10Y yield that is tearing down $OPEN stock price while management is executing better and reshaping the business. However the market doesn’t reward it.
$OPEN is no longer a meme stock.
It's a mortgage rate with a ticker.
Mortgage rates just broke 7% for the first time since January 2025. The 10-year Treasury hit a 19-year high.
Despite this pressure on the stock price, the reversal can be even more dramatic.
I ran 1,461 days of data. The 30-year Treasury, the one on every chart, is the weakest signal of the lot. The mortgage rate explains about 90% of where OPEN has traded since May.
That's the bad news.
What should make every bear nervous is that the same math runs in reverse.
I built a formula that prices OPEN at every mortgage rate from 7.50% down to 6.00%. There's a rate where it roughly doubles from here.
But right now, OPEN is trading about 16% above where rates say it should be.
Either the market knows something the rates don't, or the stock is about to catch down. Historically, half of a gap like that closes in about four trading days.
Meanwhile, Opendoor is quietly selling 6.5% mortgages in a 7% market. It's not free, and I show what it really costs them.
Full breakdown below.
$OPEN holders when they see the 10Y yield drop below 4.7% again and the stock starts ripping
Opendoor is truly in a wild place:
the 10Y yield that is tearing down $OPEN stock price while management is executing better and reshaping the business. However the market doesn’t reward it.
$OPEN is no longer a meme stock.
It's a mortgage rate with a ticker.
Mortgage rates just broke 7% for the first time since January 2025. The 10-year Treasury hit a 19-year high.
Despite this pressure on the stock price, the reversal can be even more dramatic.
I ran 1,461 days of data. The 30-year Treasury, the one on every chart, is the weakest signal of the lot. The mortgage rate explains about 90% of where OPEN has traded since May.
That's the bad news.
What should make every bear nervous is that the same math runs in reverse.
I built a formula that prices OPEN at every mortgage rate from 7.50% down to 6.00%. There's a rate where it roughly doubles from here.
But right now, OPEN is trading about 16% above where rates say it should be.
Either the market knows something the rates don't, or the stock is about to catch down. Historically, half of a gap like that closes in about four trading days.
Meanwhile, Opendoor is quietly selling 6.5% mortgages in a 7% market. It's not free, and I show what it really costs them.
Full breakdown below.
Finally these leaps $250C exp Mar27 start to come alive $NVDA

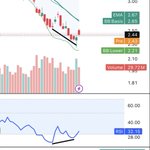
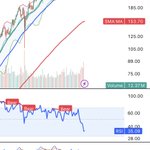
First positive divergence appears on $OPEN daily chart.
A possible sign of reversal starts to occur with prices dropping further while RSI indicates buyer’s strength returning

Considering to open a new position on $MCD
Question is if the 2M SMA50 is the support base or if that will be broken.


I added $NAUT recently as another one in the biotech fund (micro position) next to $ABCL, $IBRX , $BNGO, $TMDX and $HIMS
I did not expect this run up. Went from a 120M to a 250M market cap in a week.
Retail is going hard, the proteome platform has a lot of potential but we are still very very early. Stock needs to deliver on milestones.

Gotta love this price action and development with $IBRX
Beautiful base and break out of the Bollinger band. If it passes cleanly into $11+ we see an exit from the 0.618 rejection zone and then the next levels are towards $16.
The market starts derisking the stock.
What a year since my first purchase around $2 last year…


Sometimes I’m amazed by the stuff I write to see the signs appear after. Woah. If the US is going to inflate debt away, we will see a MASSIVE rise in equity value until the big hike begins.
Own equities or consumer purchase power will erode drastically….
$QQQ $SOXX $SPY
investwithfelix.substack.com…


JUST IN: 🇺🇸 President Trump says inflation could pay down the $40 trillion US national debt "very rapidly."

When people ask me, what do you think about $OPEN? I generally see the same development curve..
My braincells are exploding when crunching numbers and analysing the potential of this company.
The world is not ready.

Opendoor is truly in a wild place:
the 10Y yield that is tearing down $OPEN stock price while management is executing better and reshaping the business. However the market doesn’t reward it.
$OPEN is no longer a meme stock.
It's a mortgage rate with a ticker.
Mortgage rates just broke 7% for the first time since January 2025. The 10-year Treasury hit a 19-year high.
Despite this pressure on the stock price, the reversal can be even more dramatic.
I ran 1,461 days of data. The 30-year Treasury, the one on every chart, is the weakest signal of the lot. The mortgage rate explains about 90% of where OPEN has traded since May.
That's the bad news.
What should make every bear nervous is that the same math runs in reverse.
I built a formula that prices OPEN at every mortgage rate from 7.50% down to 6.00%. There's a rate where it roughly doubles from here.
But right now, OPEN is trading about 16% above where rates say it should be.
Either the market knows something the rates don't, or the stock is about to catch down. Historically, half of a gap like that closes in about four trading days.
Meanwhile, Opendoor is quietly selling 6.5% mortgages in a 7% market. It's not free, and I show what it really costs them.
Full breakdown below.
$OPEN will see a violent move that could reflect the run up of 2025 when rates will drop.
Short interest is almost 1/4 free float shares and Days to Cover is at 9.91!

I'm back. Enjoy #OpenArmy🫡

Opendoor vs 10Y Yield: a data driven breakdown of 1.4k+ trading days.
A thread 🧵
Mortgage rates just crossed 7% for the first time since January 2025 and for $OPEN , that's the only number that matters right now.
Last week I tested 1,461 days of Opendoor stock against the 5-, 10- and 30-year Treasury yields and Freddie Mac's mortgage rate. A lot has been moving in between, which is why this article's release took longer.
The mortgage rate explains about 90% of where OPEN has traded since May.
So I turned it into a rebound formula with one input, three scenarios to model against, and a price for every mortgage rate from 7.50% down to 6.00%.
The thing that surprised me is that at Friday's close, OPEN was trading about 16% above where rates say it should be.
Historically, half of a gap like that has closed within four trading days. I also looked at what Opendoor's own 6.5% mortgages really cost the company.
I went deep and added short interest and technical analysis.
Full breakdown in the article below.