

Captain Condor 🦅 | Fund Manager | Market Mover | Memes + Math = Alpha
Joined March 2020
- Tweets651
- Following7.2K
- Followers11.9K
- Likes4.8K



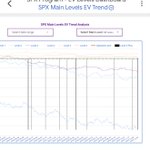



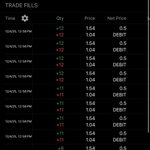


SPX iron condor, entered at the close, expiring the next day. 20-delta shorts, $5 wide wings, collects about $170 against $330 of risk. 1,091 trades, May 2022 through September 2026.
Unfiltered, it has no edge. EV is basically zero, 64% win rate. The median trade wins $158, and the tail losses hand it all back. That is before commissions. If you sell these every day on autopilot, you are donating.
But one condition changes everything: how much SPX moved yesterday.
When SPX moved 1% or more the day before entry, the same condor made +$40 per trade across 278 trades. Positive in all 5 years. At 1.5% or more, +$44.
And it is monotonic. Big prior move: +$32. Medium move: -$12. Quiet day: -$21. The calmer yesterday was, the worse the condor does today.
The logic is simple once you see it. After a big day, implied vol stays scared while the market usually calms down. You are selling yesterday's fear at tomorrow's prices. On quiet days there is no fear premium to collect, but the tail risk is still there. Same $170 credit, none of the edge.
Two more findings. Friday entries were the best day (+$29, weekend decay into the Monday expiry) and Wednesday entries the worst (-$31). And a high VIX minus realized vol spread, which every premium seller is taught to love, was a losing condition here (-$15). In a 1DTE condor, that spread usually means live stress, not rich premium.
Best combo: prior-day move of 1% or more on a Thursday or Friday entry. +$65 per condor across 132 trades.
Honest caveats: daily closes only, no commissions or slippage modeled, and I sliced the data a lot of ways. The prior-move result is the one I trust because it is monotonic, it worked every year, and the mechanism makes sense.
Historically realize vol is always under implied vol, so selling condors when realize vol is above will naturally revert.
You guys asked for crypto, so I ran the %B bottom study on BTC and ETH. The answer is uncomfortable.
Same setup as the SPY study. 6.75 years of dailies. 11-day pivot windows. Bottoms confirmed by a 5% bounce within 10 days. %B(20,2) under 0.15 as the washout flag.
BTC: 125 confirmed bottoms. The flag caught 44 of them. 35%.
ETH: 129 bottoms. Caught 39%.
Compare that to 62.5% on SPY. The rule does not port.
Look at where bottoms actually print. Median %B at a BTC bottom is 0.26. On SPY it is 0.10. Crypto bottoms do not get as washed out relative to the bands, because the bands themselves are enormous in a volatile market. The 0.15 line was fit to SPY's personality.
Two more problems. Gold was worse than crypto: 32% recall, and the flag fired on 23% of ordinary gold days. In a slow grindy market the flag trips constantly and means nothing. And the 5% confirmation that works for SPY is noise for crypto. BTC printed 125 "bottoms" in 6.75 years. Most of those are wiggles, not washouts. You would want a 15-20% confirmation move before the pivots mean anything on BTC.
The one thing that survived everywhere: specificity. Across 345 tops in BTC, ETH, GLD, and SLV, the flag fired on 3. It still does not mistake tops for bottoms. It is just much worse at finding bottoms anywhere but SPY.
The lesson I keep relearning: indicators have personalities. A rule found on one market is a hypothesis about that market, not a law. Test it on the new market before you trust it there.
Sources: price data from Yahoo Finance (GLD, SLV, BTC-USD, ETH-USD daily bars, 2019-2026). SPY reference figures from the same study using Yahoo Finance and Polygon. Pivots defined as the lowest low in an 11-day window, confirmed by a 5% rally within 10 days. %B computed on 20-day, 2 standard deviation Bollinger Bands at the daily close.
I reverse-engineered every buyable bottom on SPY.
Here is what actually flagged them.
Instead of debating which indicator predicts bottoms, I worked backwards. I took 2 years of SPY daily data (501 trading days), found every pivot low that bounced 5% or more within 10 days (7 of them) and every pivot high that dropped 5% or more (3 of them), then measured what 13 technical studies were printing at each exact turning point versus ordinary days.
The winner surprised me.
Bollinger %B under 0.15 caught 86% of the buyable bottoms.
6 out of 7 bottoms printed %B below 0.15 at the pivot close. Zero of the tops did. Only 7% of ordinary days did. Quick refresher: %B measures where price sits inside the Bollinger Bands. 1.0 is the upper band, 0 is the lower band, below 0 means price closed under the lower band.
How the studies ranked (median at bottoms vs ordinary days):
• MACD histogram: -2.80 vs +0.42 (catches everything, but noisy, 43% false positives)
• Bollinger %B: 0.11 vs 0.67 (the clean trigger)
• Stochastic %K: 16 vs 83
• Stochastic %D: 21 vs 83
• RSI(14): 39.6 vs 55.3
The RSI surprise: median RSI at real bottoms was 39.6, not 30. The classic "buy when RSI goes under 30" rule caught only 29% of actual bottoms. Waiting for deep oversold meant missing most of the bounces.
Three rules worth forward-testing:
1. %B under 0.15 alone: 86% of bottoms, 7% false positive rate. Best single filter in the study.
2. %B under 0.15 AND price under the 50-day average: keeps most bottoms, trims the noise further.
3. RSI under 35 AND %B under 0.15: only caught 29% of bottoms, but zero false flags anywhere. Rare, high conviction when it fires.
Recent flags for reference:
Jul 29 2026 (%B -0.16, then +6.1%),
Jun 26 2026 (%B 0.14, then +5.0%),
Mar 30 2026 (%B -0.02, then +7.6%).
The honest part, because small samples lie: 7 bottoms is thin, the window was mostly bull market, and tops had no clean signal at all. In September the flag tripped 4 times without a full 5% bounce following, so treat %B under 0.15 as "conditions are washed out," not "bottom confirmed."
I am setting up automations to flag for these triggers live. When the next %B washout flags it will auto post in my slack. Was only able to pull for a couple years but would like to see a larger sample set

Open to your feedback, we kinda figured out the issue and patched it. Discrepancies with how algo pulled our strikes was one.
Our models a bit more complicated now we run comps between martingale vs fixed models and surprisingly some of the fixed models are outperforming


David Chau retweeted

you shall not underestimate the power our captain condor holds on the market lol
april was a tough lesson for many becoming fearful despite captain condor coming to the rescue

Merry Christmas,
I wish nothing but success for all.
Anytime an iron condor breaches we track the levels over the last 3 years and we build our quantitative model around this.
This is the first time our series failed in over 3 years since CBOE released dailies in 2022, 1 series. you can’t backtest anything prior. So yes we are pioneers.
Black Scholes options pricing formula uses implied volatility not future. I suspect these conditions offered perfect opportunity for range breaches. I didn’t expect this to be any different than any other time we traded. We have rules and followed the books. We don’t normally close trades because all stats are realized at the close, Often have seen markets breach and close back inside. This is how our long model works (the one that predicts 1SD breaches) But they don’t work together to complement short IC.
The premise of our strategy is not about avoiding losses, it’s about generating positive expectancy.
Positive EV in this strategy is accepting that these events will happen because it’s a probability based system , but if you started with x$ and doubled or tripled the amount, you take off principle and scale the rest with house $.
In a nutshell, yes we are hurt but I don’t fucking give up. We will regroup and try again.


Interesting over the last 11 years, the chance of a Santa Claus rally is 63%. Average gain wasn’t that much impressive either.
If taking a larger sample size and further, it would probably be closer to 70%+
Might make more sense to pull from 2020+ after the retail boom.
Casinos ban certain strategies to protect their edge. There are interesting parallels between how casinos manage risk and how traders can think about probability.
Most traders approach markets without a statistical framework. They pick directions, chase setups, and hope they’re right more often than wrong.
Casinos operate differently. They rely on probability and statistics to maintain consistent advantages over thousands of transactions.
Looking at how casinos manage risk offers useful educational comparisons to options trading. Here are a few concepts that I think stand out:
#1: The Martingale approach is based on scaling position size after losses.
Casinos restrict this model with table limits. The mechanics are simple:
- Bet $10 and lose → next bet is $20
- Lose again → next bet is $40
- Continue scaling until a win
The model is designed so a win could offset earlier losses, but this assumes unlimited capital... something neither casinos nor traders have. Table limits exist to prevent this approach from being feasible.
While markets don’t impose table limits, traders still face natural constraints like capital, volatility, and risk tolerance.
#2: Card counting estimates when probabilities shift.
The MIT Blackjack team used card counting to identify when the deck statistically favored the player. Casinos eventually restricted this behavior.
In options trading, probability estimates appear directly in the options chain. Traders can evaluate different strikes and expirations using those estimates — similar in spirit to how card counters evaluated deck composition, though market dynamics are far more complex.
#3: Small statistical advantages become meaningful over large samples.
Casinos profit from a small percentage edge across thousands of transactions.
In options trading, probability estimates help traders structure defined-risk positions. Higher-probability trades typically offer smaller potential returns, while lower-probability setups may offer asymmetric outcomes. Nothing is guaranteed, and performance varies, but sample size and position sizing matter.
#4: Structural rules shape what strategies are viable.
Casino table limits prevent infinite scaling. This constraint defines which betting strategies remain possible.
Markets operate with different structural rules. Traders adjust position size based on available capital and risk management preferences. Understanding these differences helps clarify which concepts translate across environments... and which don’t.
The bottom line?
Casinos operate on statistical edges and disciplined probability management. Markets offer probability-based frameworks too, though outcomes remain uncertain. Recognizing how different environments manage risk can offer helpful context for thinking about trading in a probability-informed way.
Educational only. Not investment advice. All trading involves risk.

So since Japan is considered cheap
Money and people primarily borrow cheap money to arbitrage foreign investments.
If BOJ is expected to raise rates, this might force traders to unwind their leveraged positions causing a sell off in risk assets like crypto, tech.
I’m not an expert but is there a place to pull high institutional ownership specifically for the yen carry trades. Or just $SQQQ and call it a day?
I would imagine all the big boys are systematic leveraged hubs like NVDA , TSLA, META , AMZN.
I just picked up a pair of skis, will be my first time switching over from snowboarding.
Does anybody do both, is it easy to transition lol
We won our trade on Wednesday with FOMC long debits. Model doesn’t predict a specific time, it’s more of a range of days so today was just a bonus / follow through.

nice call by your model btw
you should have said Tue- Fri :)
xitter.cf/InsideOptions_/status/…