

Experienced, retired investor.
San Francisco
Joined April 2009
- Tweets3.8K
- Following31
- Followers264
- Likes22



Pinned Tweet
Would you spend $6.95 per month to make $650.00. Join one of the fastest growing rooms on Stocktwits at stocktwits.com/r/IncomeStrat… We search for the best Covered Calls and Credit Spreads and follow them to completion. One-on-one training/advising available. #investing #stocks $AMD

In 1970, my widowed, now 96 mother-in-law purchased a @pacificlife insurance policy. It was managed by @UBS. It is now worth $0.00 and she has lost $60,000.00.
29
My 96 year old, widowed mother-in-law purchased a $100,000.00 Pacific Life Insurance policy in 1970. It was managed by UBS. It is now worth $0.00 and she has lost $60,000.00.
33


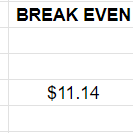
$FRC Covered Call with 500 shares, strike $13.5, expiring April 6. If assigned at $13.5 the net profit is $1,180.00 in 10 days for a return of 21.18% annualized at 773% (for comparison purposes.

183


Dow closes 300 points lower after strong jobs data signals more rate hikes. January 5, 2023
CNBC
Dow jumps 500 points as December jobs report eases rate worries
By Reuters
January 6, 2023
What the heck?
$SPY
1
84


$TNA 3X Small Cap ETF. Linear Regression fits the best average line between any two points, thereby showing the trend clearly and accurately. (just a chart, not a prediction).


Just a chart showing the 20-day moving average of the advance/decline line crossing the 200-day moving average. The 50-day moving average is now on an incline. $SPY

1