

Your #1 source for income ETF news, data, and distribution tracking | We track the ETFs that put money in your pocket every month
Joined April 2026
- Tweets1.6K
- Following183
- Followers4.4K
- Likes1.3K



Pinned Tweet
Join us this Thursday 1:30est
xitter.cf/i/spaces/1qKDzWEwRWLJV…
This Thursday with @TappAlphaFunds

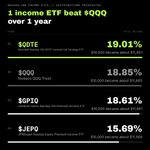
Roundhill Nasdaq-100 0DTE Covered Call Strategy ETF $QDTE beat Invesco QQQ Trust $QQQ over 1 year.
Total return, October 16, 2025 close to October 16, 2026 close, distributions reinvested:
🥇 $QDTE 19.01% 🟢
🥈 $QQQ 18.85%
🥉 Goldman Sachs Nasdaq-100 Premium Income ETF $GPIQ 18.61%
4. JPMorgan Nasdaq Equity Premium Income ETF $JEPQ 15.69%
$10,000 became about $11,901 in $QDTE, $11,885 in $QQQ, $11,861 in $GPIQ and $11,569 in $JEPQ. The $QDTE share price fell 20.03% over the window. The rest came from 52 weekly distributions.
Past performance does not guarantee future results.
Distribution rate is not total return.

iShares 20+ Year Treasury Bond BuyWrite Strategy ETF $TLTW lost less than iShares 20+ Year Treasury Bond ETF $TLT in all 3 windows.
Total return to the October 16, 2026 close, distributions reinvested:
🟢 3 months: $TLTW -2.52% versus $TLT -3.81%
🟢 6 months: $TLTW -3.43% versus $TLT -5.05%
🟢 1 year: $TLTW -3.71% versus $TLT -8.28%
Windows start at the July 16, 2026, April 16, 2026 and October 16, 2025 closes. $10,000 over 1 year became about $9,629 in $TLTW and $9,172 in $TLT. A smaller loss is still the better result.
Past performance does not guarantee future results.
Distribution rate is not total return.

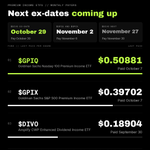
🚨 NEXT EX-DATES: premium income ETFs with monthly distributions
🟢 Amplify CWP Enhanced Dividend Income ETF $DIVO: ex October 29, pay October 30. Then ex November 27, pay November 30
🟢 Goldman Sachs Nasdaq-100 Premium Income ETF $GPIQ and Goldman Sachs S&P 500 Premium Income ETF $GPIX: ex November 2, pay November 6
Last paid per share, most cash first:
🥇 $GPIQ $0.50881 (paid October 7)
🥈 $GPIX $0.39702 (paid October 7)
🥉 $DIVO $0.18904 (paid September 30)
Upcoming amounts are not declared yet and change.
Distribution rate is not total return.

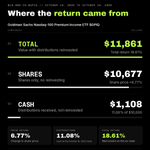
Where the return came from.
$10,000 in Goldman Sachs Nasdaq-100 Premium Income ETF $GPIQ, October 16, 2025 close to October 16, 2026 close:
🟢 Shares only, no reinvesting: about $10,677 (share price +6.77%)
🟢 Cash from distributions, not reinvested: about $1,108 (11.08% of the starting value)
🟢 Total with distributions reinvested: about $11,861 (total return 18.61%)
Reinvesting each distribution on its ex-date is what total return measures.
Past performance does not guarantee future results.
Distribution rate is not total return.

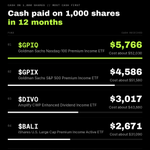
1,000 shares. Cash paid out in 12 months.
Cash received on 1,000 shares from October 17, 2025 to October 16, 2026, and what 1,000 shares cost at the October 16, 2025 close, most cash first:
🥇 Goldman Sachs Nasdaq-100 Premium Income ETF $GPIQ $5,766 cash · cost about $52,030 🟢
🥈 Goldman Sachs S&P 500 Premium Income ETF $GPIX $4,586 cash · cost about $51,580 🟢
🥉 Amplify CWP Enhanced Dividend Income ETF $DIVO $3,017 cash · cost about $43,880 🟢
4. iShares U.S. Large Cap Premium Income Active ETF $BALI $2,671 cash · cost about $31,090 🟢
Cash is the sum of per share distributions over 12 months times 1,000 shares, not reinvested. Past distributions. Amounts change.
Past performance does not guarantee future results.
Distribution rate is not total return.

Thanks for having us on!!! 🔥🔥

Why you need Crypto Income ETFs!
Check out my latest video that I did with @randrewcworth @IncomeETFDaily ↓
#crypto #btc #cryptoetf
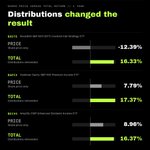
Share price versus total return over 1 year.
October 16, 2025 close to October 16, 2026 close. Total return reinvests distributions:
Roundhill S&P 500 0DTE Covered Call Strategy ETF $XDTE: share price -12.39%, total return 16.33%
Goldman Sachs S&P 500 Premium Income ETF $GPIX: share price 7.79%, total return 17.37%
Amplify CWP Enhanced Dividend Income ETF $DIVO: share price 8.96%, total return 16.37%
$XDTE paid 52 weekly distributions. $GPIX and $DIVO paid 12 monthly distributions.
Past performance does not guarantee future results.
Distribution rate is not total return.

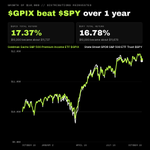
Goldman Sachs S&P 500 Premium Income ETF $GPIX beat State Street SPDR S&P 500 ETF Trust $SPY over 1 year.
Total return, October 16, 2025 close to October 16, 2026 close, distributions reinvested:
🟢 $GPIX 17.37%
$SPY 16.78%
$10,000 in $GPIX grew to about $11,737. $10,000 in $SPY grew to about $11,678.
The $GPIX share price rose 7.79% over the window. The rest came from 12 monthly distributions. $GPIX was ahead of $SPY on 152 of 252 trading days.
Past performance does not guarantee future results.
Distribution rate is not total return.

iShares U.S. Large Cap Premium Income Active ETF $BALI beat State Street SPDR S&P 500 ETF Trust $SPY in all 3 windows.
Total return to the October 16, 2026 close, distributions reinvested:
🟢 3 months: $BALI 2.84% versus $SPY 1.92%
🟢 6 months: $BALI 10.23% versus $SPY 9.33%
🟢 1 year: $BALI 19.90% versus $SPY 16.78%
Windows start at the July 16, 2026, April 16, 2026 and October 16, 2025 closes. $10,000 over 1 year became about $11,990 in $BALI and $11,678 in $SPY.
Past performance does not guarantee future results.
Distribution rate is not total return.

6 Nasdaq-100 income ETFs beat Invesco QQQ Trust $QQQ over 3 months.
Total return, July 16, 2026 close to October 16, 2026 close, distributions reinvested:
🥇 REX AI Equity Premium Income ETF $AIPI 8.29% 🟢
🥈 REX FANG & Innovation Equity Premium Income ETF $FEPI 5.28% 🟢
🥉 Global X Nasdaq 100 Covered Call ETF $QYLD 4.66% 🟢
4. JPMorgan Nasdaq Equity Premium Income ETF $JEPQ 2.55% 🟢
5. NEOS Boosted Nasdaq-100 High Income ETF $XQQI 1.11% 🟢
6. NEOS Nasdaq-100 High Income ETF $QQQI 1.02% 🟢
7. Invesco QQQ Trust $QQQ 0.65%
Past performance does not guarantee future results.
Distribution rate is not total return.

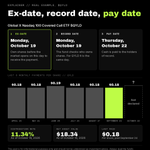
Ex-date, record date and pay date, explained with a real example.
Real example, Global X Nasdaq 100 Covered Call ETF $QYLD:
🟢 Ex-date Monday, October 19: own shares before the market opens to receive the payment
🟢 Record date Monday, October 19: the fund checks who owns shares (same day for $QYLD)
🟢 Pay date Thursday, October 22: cash is paid to holders of record
The last 6 monthly payments were $0.18, $0.18, $0.19, $0.18, $0.18 and $0.18 per share, paid April 23 to September 24. The October amount is not declared yet.
Amounts are not guaranteed and change.
Distribution rate is not total return.

4 NEOS bond ETFs were ahead of 4 iShares ETFs over 1 year.
Total return, October 16, 2025 close to October 16, 2026 close, distributions reinvested:
🟢 NEOS Enhanced Income 1-3 Month T-Bill ETF $CSHI 4.97% versus iShares 0-3 Month Treasury Bond ETF $SGOV 3.77%
🟢 NEOS Enhanced Income Credit Select ETF $HYBI 3.44% versus iShares iBoxx $ High Yield Corporate Bond ETF $HYG 1.25%
🟢 NEOS Enhanced Income Aggregate Bond ETF $BNDI 0.05% versus iShares Core U.S. Aggregate Bond ETF $AGG -1.79%
🟢 NEOS Enhanced Income 20+ Year Treasury Bond ETF $TLTI -6.39% versus iShares 20+ Year Treasury Bond ETF $TLT -8.28%
Past performance does not guarantee future results.
Distribution rate is not total return.

$10,000 invested October 16, 2025. Cash paid out in 12 months.
Cash received on $10,000 and what the shares were worth on October 16, 2026, most cash first:
🥇 REX FANG & Innovation Equity Premium Income ETF $FEPI $2,318 cash · shares worth $8,669 🟢
🥈 Global X Nasdaq 100 Covered Call ETF $QYLD $1,240 cash · shares worth $10,651 🟢
🥉 JPMorgan Nasdaq Equity Premium Income ETF $JEPQ $1,206 cash · shares worth $10,296 🟢
4. JPMorgan Equity Premium Income ETF $JEPI $807 cash · shares worth $10,094 🟢
Cash is the sum of per share distributions over 12 months divided by the October 16, 2025 close, not reinvested. Past distributions. Amounts change.
Past performance does not guarantee future results.
Distribution rate is not total return.

3 S&P 500 income ETFs beat State Street SPDR S&P 500 ETF Trust $SPY over 3 months.
Total return, July 16, 2026 close to October 16, 2026 close, distributions reinvested:
🥇 NEOS Boosted S&P 500 High Income ETF $XSPI 3.58% 🟢
🥈 NEOS S&P 500 High Income ETF $SPYI 2.73% 🟢
🥉 JPMorgan Equity Premium Income ETF $JEPI 2.02% 🟢
4. State Street SPDR S&P 500 ETF Trust $SPY 1.92%
$10,000 became about $10,358 in $XSPI, $10,273 in $SPYI, $10,202 in $JEPI and $10,192 in $SPY.
Past performance does not guarantee future results.
Distribution rate is not total return.

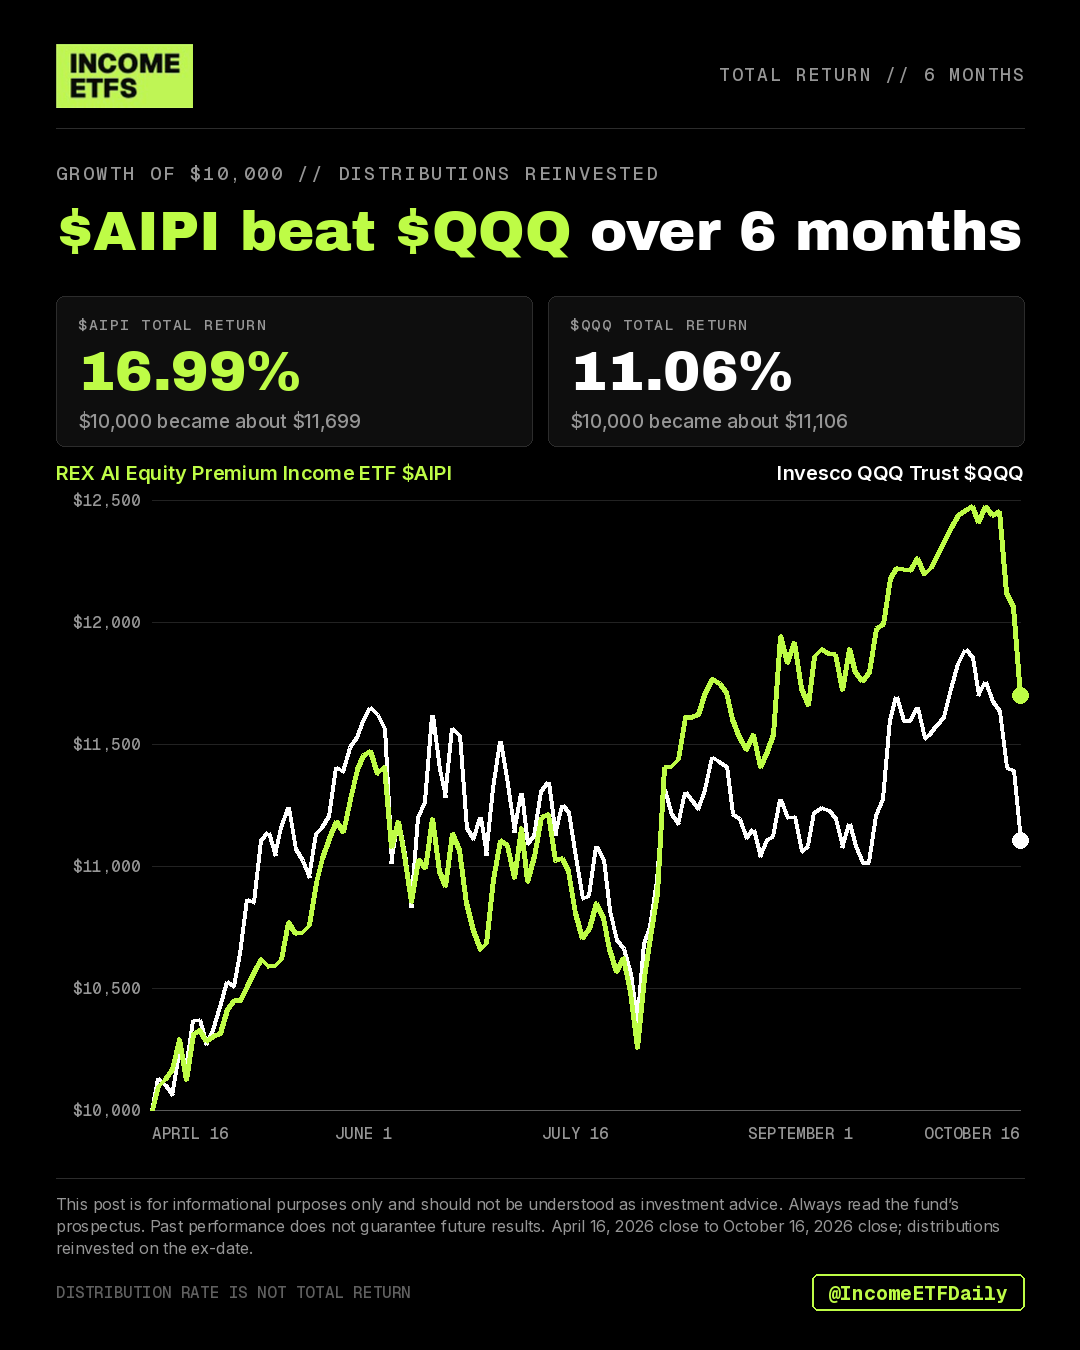
REX AI Equity Premium Income ETF $AIPI beat Invesco QQQ Trust $QQQ over 6 months.
Total return, April 16, 2026 close to October 16, 2026 close, distributions reinvested:
🟢 $AIPI 16.99%
$QQQ 11.06%
$10,000 in $AIPI grew to about $11,699. $10,000 in $QQQ grew to about $11,106.
The $AIPI share price fell 1.35% over the window. The rest came from 22 distributions.
Past performance does not guarantee future results.
Distribution rate is not total return.
🚨 EX-DISTRIBUTION MONDAY: October 19, 2026
Global X monthly covered call ETFs go ex-distribution Monday, October 19, with record date October 19 and pay date Thursday, October 22. Last paid amounts per share (September 24 payment), most cash first:
🥇 Global X S&P 500 Covered Call ETF $XYLD $0.30 per share · 8.41% distribution rate 🟢
🥈 Global X Nasdaq 100 Covered Call ETF $QYLD $0.18 per share · 11.34% distribution rate 🟢
🥉 Global X Russell 2000 Covered Call ETF $RYLD $0.15 per share · 11.45% distribution rate 🟢
October amounts are not declared yet. Distribution rates as of October 16, 2026. Next ex-dates: November 23, December 21 and December 30.
Distribution rate is not total return.

Distributions hitting the brokerage is an exciting and unique feeling.
Anyone else look forward to Fridays payday?


NEOS Russell 2000 High Income ETF $IWMI beat iShares Russell 2000 ETF $IWM in all 3 windows.
Total return to the October 16, 2026 close, distributions reinvested:
🟢 3 months: $IWMI -6.27% versus $IWM -8.27%
🟢 6 months: $IWMI 1.82% versus $IWM 0.68%
🟢 1 year: $IWMI 12.95% versus $IWM 11.48%
Windows start at the July 16, 2026, April 16, 2026 and October 16, 2025 closes. A smaller loss over 3 months is still the better result.
Past performance does not guarantee future results.
Distribution rate is not total return.

$IBIT returned 26.57% over the last 3 months. The boosted bitcoin income ETF returned 31.90%.
Total return, July 15, 2026 close to October 15, 2026 close, distributions reinvested:
🟢 NEOS Boosted Bitcoin High Income ETF $XBCI 31.90%
iShares Bitcoin Trust ETF $IBIT 26.57%
$10,000 in $XBCI grew to about $13,190. $10,000 in $IBIT grew to about $12,657.
The $XBCI share price rose 19.47%. The rest came from 3 monthly distributions. $XBCI was ahead on all 65 trading days in the window. Per NEOS, $XBCI seeks up to 150% notional exposure using options.
Past performance does not guarantee future results.
Distribution rate is not total return.

How a weekly distribution rate is built, in plain English.
A weekly fund's distribution rate takes ONE payment, multiplies it by 52, and divides by the recent share value.
Real example, YieldMax AMD Option Income Strategy ETF $AMDY, last 6 weekly distributions per share:
🟢 Paid September 11: $0.3763
🟢 Paid September 18: $0.3906
🟢 Paid September 25: $0.7791
🟢 Paid October 2: $0.9871
🟢 Paid October 9: $1.0254
🟢 Paid October 16 (today): $0.6677
The 70.46% rate uses only today's amount: $0.6677 times 52 is $34.72 per share per year. The highest week times 52 is $53.32. The lowest is $19.57. Same fund, very different annualized numbers.
Amounts are not guaranteed and change every week. Teaching example only.
Distribution rate is not total return.
