

Building better societies, one data point at a time. We are dedicated to creating actionable, practical tools that empower leaders across the UK.
UK
Joined March 2023
- Tweets131
- Following133
- Followers48
- Likes78




Over 1.17m adults (19+) took part in FE & skills in England last year.
For local councils, this isn't just an education metric—it’s a key indicator for inward investment, devolution efficiency, and preventive public service strategy.
Insights: v2.placeinsight.co.uk/blog/f…
🤖 Made with AI

98.8% of UK households live within 10 km of a GP. 🏥
But living close to a GP doesn’t mean being able to see one. Capacity and appointment availability can be the bigger barriers.
See what access looks like in your area with Place Insight: v2.placeinsight.co.uk/blog/d…

Local priorities change. Your data should show you where and how.
With Place Insight’s Year Comparison dashboard, local authorities can track progress, compare areas and spot emerging trends over time.
Explore your area: v2.placeinsight.co.uk/
#LocalGovernment #PlaceInsight

Mortality rates aren't standalone. A high local death rate links to housing, employment & care access.
The Place Insight platform tracks the UK Death Rate indicator alongside 69 other metrics:
👉 v2.placeinsight.co.uk/blog/d…
#LocalGov #PublicHealth
🤖 Made with AI

Housing pressures don’t exist in isolation.
Supply, affordability, homelessness and affordable housing delivery are deeply connected.
Place Insight’s Housing Insights dashboards help local authorities see those connections and turn local data into better-informed policy.

What is the housing data telling you about your area?
Explore dwelling stock, housing supply, affordable housing and wider market pressures through Place Insight’s Local Policy Housing Insights.
See the dashboards 👇
v2.placeinsight.co.uk/
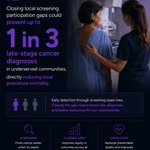
Closing local screening gaps could prevent up to 1 in 3 late-stage cancer diagnoses in underserved communities.
Place Insight helps local authorities identify vulnerable areas. Use the POI Map to understand the services, access and local factors around them.
#PublicHealth #UK
🤖 Made with AI

Want to see what the data looks like in your area?
Explore our Cancer Mortality Indicator Insight to compare local patterns, identify areas of concern and understand how outcomes vary across England.
👉 v2.placeinsight.co.uk/blog/c…
Local authorities have a lot of data. The challenge is seeing what it says about a place.
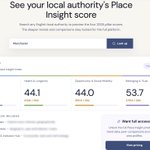
The Place Profile brings it together: one overall score and ranking, with the themes and indicators behind it.
See where your area is doing well and where to look closer.
#PlaceInsight
🤖 Made with AI

Want to see how your local authority performs?
👉 Explore your local authority on Place Insight
v2.placeinsight.co.uk/
Up to 80% of premature cardiovascular deaths are preventable.
Yet CVD accounts for 20% of the life expectancy gap between England’s most and least deprived communities.
For local authorities, prevention starts with understanding place.
#PublicHealth #LocalGov #placeinsight
🤖 Made with AI

What does cardiovascular health look like in your local area?
Explore the data, compare local authorities and uncover the wider factors shaping health outcomes with Place Insight 👇
v2.placeinsight.co.uk/blog/c…
Place Insight brings together 69 indicators across England to help you:
🗺️ Explore the map
📊 Compare places
📈 Track change over time
Start with your local authority and see what the data tells you.
v2.placeinsight.co.uk/
#DataAnalytics
🤖 Made with AI

Want to go deeper into the data?
Explore our Indicator Insights to understand the trends, context and local relevance behind the measures in Place Insight.
Explore the insights ↓
v2.placeinsight.co.uk/blog
How is your local authority performing?
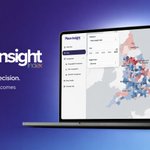
The Place Insight Index turns complex place-based data into clear insights that help decision-makers to prioritise investment in place in Encland
View your 2025 Place Score for free at:
📍 v2.placeinsight.co.uk/
#Data #UK


Impera Analytics retweeted
How is your local authority performing?
The Place Insight Index turns complex place-based data into clear insights that help decision-makers to prioritise investment in place in Encland
View your 2025 Place Score for free at:
📍 v2.placeinsight.co.uk/
#Data #UK
Where are prevention efforts making the biggest difference?
Cancer mortality is one of the clearest indicators of long-term population health and is influenced by housing, air quality, deprivation, and access to care.
Learn more: v2.placeinsight.co.uk/blog/c…
#UK #Data #places
🤖 Made with AI

Place Insight transforms data into actionable stories, driving impact in policy-making. 🌟
🔹 12 key policy themes
🔹 30+ data sources, incl. Social Progress Index™
🔹 Intuitive visualisations
Move from “what is” to “what could be.” Learn more: impera-analytics.com/placein…

🎉 Counting down our 2024 highlights!
We’re kicking things off with how our insights supported Net Zero initiatives, enabling data-driven decisions for a sustainable future. 🌍
👉 Read more: impera-analytics.com/data-to…
Stay tuned for more impact stories! 🙌
